2 key concepts for traders

This past Wednesday I did an AMA with Kris Longmore’s RobotWealth community. Kris’ work and general way of being is a personal inspiration. I’m a big fan.

(His bootcamp is my #1 recommended course for retail trading because it’s grounded in both the practicality of trading but also in the conceptual — what is edge, where to find it and why it might exist)

This is all to say it was quite an honor to nerd out on his channel 🤓

​📽️Watch the replay of our conversation here.

Just a sampling of topics we discussed:

  • Some differences between professional and retail trading
  • How a retail trading operation can be set up to align with your life
  • Good options trades and where to find them
  • How important is modeling time decay?
  • How important is backtesting for options strategies?

2 ideas that received some extra emphasis:

1) Traders are searching for contradiction not prediction

This is a callback to Measurement Not Prediction which explains why trading rests on “seeing the present clearly” as opposed to playing Nostradamus. The distinction might sound abstract or subtle. This section of a thread I wrote this week is a concrete example:

2) On timing vol

The topic of timing vol came up. And I shared something I suspect people might find surprising.

I had no edge in timing vol. In fact, I don’t think most professional vol traders have any edge in this. In other words, their edge doesn’t look anything like “vol in general is cheap here, let’s load up”. I almost always regret drawing lines in the sand about getting net long or short a bunch of vega. Did I tend to be leaning long vol when it was cheap and vice versa? Sure, but I was usually long or short for a considerable amount of time before it bottomed or peaked too, because markets love to stretch like they’re double-jointed ballerinas before reverting.

After getting humbled by a timing opinion gone awry, I always centered myself by going to back to basics. What does that mean?

The most basic decision in a trader’s arsenal, their reliable fastball so-to-speak is some version of:

“I’m buying this for X, because that is Y bid”

“I’m buying 1-month APPL straddles for X vol, because 3-month QQQ puts are Y bid”.

When you get away from decisions that take that grammatical form you are in the realm of “I’m buying this because the line went down”.

When you feel enough pain to accept that you did something wrong you will usually find this subtle switch in decision logic is the source. It stings the ego because re-focusing on the basics is admitting that you haven’t transcended the grind to become some market maven who just knows when something is about to turn.

(I think all traders subconsciously expect that their 10,000 or even 20,000 hours of practice will unlock that ability. These back-to-basic moments, if you are lucky enough to overcome your pride and negative p/l, to rediscover are humble reminders that markets are learning just like you are so the value of the 10,000 hours isn’t exerted on your ability to beat them, but instead on the practice of process so you have a chance of keeping up. There’s no “best”, only “next”.)

Moontower #252

Friends,

This one is more investing-centric than a typical Sunday letter but before going there I want to add another gift guide to the lists I published this week.

🎁The 2024 Kottke Holiday Gift Guide

This list is extensive and will lead to link-diving into many well-curated offshoots.

One of those offshoots is an awesome guide directed toward children’s gifts (but there’s plenty even an adult would love!):

🦖The Kids Should See This (Gift Guide 2024)

Lots of nerdy ideas in there as well including a link to Purdue’s School of Engineering gift guide for kids!


On to trading stuff.

This past Wednesday I did an AMA with Kris Longmore’s RobotWealth community. Kris’ work and general way of being is a personal inspiration. I’m a big fan.

(His bootcamp is my #1 recommended course for retail trading because it’s grounded in both the practicality of trading but also in the conceptual — what is edge, where to find it and why it might exist)

This is all to say it was quite an honor to nerd out on his channel 🤓

​📽️Watch the replay of our conversation here.

Just a sampling of topics we discussed:

  • Some differences between professional and retail trading
  • How a retail trading operation can be set up to align with your life
  • Good options trades and where to find them
  • How important is modeling time decay?
  • How important is backtesting for options strategies?

2 ideas that received some extra emphasis:

1) Traders are searching for contradiction not prediction

This is a callback to Measurement Not Prediction which explains why trading rests on “seeing the present clearly” as opposed to playing Nostradamus. The distinction might sound abstract or subtle. This section of a thread I wrote this week is a concrete example:

2) On timing vol

The topic of timing vol came up. And I shared something I suspect people might find surprising.

I had no edge in timing vol. In fact, I don’t think most professional vol traders have any edge in this. In other words, their edge doesn’t look anything like “vol in general is cheap here, let’s load up”. I almost always regret drawing lines in the sand about getting net long or short a bunch of vega. Did I tend to be leaning long vol when it was cheap and vice versa? Sure, but I was usually long or short for a considerable amount of time before it bottomed or peaked too, because markets love to stretch like they’re double-jointed ballerinas before reverting.

After getting humbled by a timing opinion gone awry, I always centered myself by going to back to basics. What does that mean?

The most basic decision in a trader’s arsenal, their reliable fastball so-to-speak is some version of:

“I’m buying this for X, because that is Y bid”

“I’m buying 1-month APPL straddles for X vol, because 3-month QQQ puts are Y bid”.

When you get away from decisions that take that grammatical form you are in the realm of “I’m buying this because the line went down”.

When you feel enough pain to accept that you did something wrong you will usually find this subtle switch in decision logic is the source. It stings the ego because re-focusing on the basics is admitting that you haven’t transcended the grind to become some market maven who just knows when something is about to turn.

(I think all traders subconsciously expect that their 10,000 or even 20,000 hours of practice will unlock that ability. These back-to-basic moments, if you are lucky enough to overcome your pride and negative p/l, to rediscover are humble reminders that markets are learning just like you are so the value of the 10,000 hours isn’t exerted on your ability to beat them, but instead on the practice of process so you have a chance of keeping up. There’s no “best”, only “next”.)

🌙Last Call🌙

You are welcome to use the ROBOTWEALTH promo code for 15% off moontower.ai plans. It expires tonite.


Money Angle

Several weeks ago I wrote Tax-Loss Harvesting On Levered Long/Short.

I recommend reading it to understand why it’s more valuable to have:

a gain of $200k + a loss of $100k

vs

a gain of $100k

The first grants you loads of optionality in managing current and future tax liabilities.

The rise of direct indexing, SMAs, and portfolio margining creates avenues for engineering the former in lieu of the latter.

I’ll tell you now you are going to hear more about tax-loss harvesting with a long/short extension in the coming year.

Why?

1) The knowledge and technology for managing this is becoming more widespread.

2) With US markets near all-time highs within a generational boom in stock-based comp, many people are sitting on massive gains in concentrated positions. Many are anxious to diversify but wary of the tax bill.

And a 3rd, more shadowy reason:

3) Passive index investing as an idea is begging to peak

Filed under “this is why we can’t nice things” — MSTR is going to be added to QQQ.

Another risk-loving corporate actor with an affinity for financial engineering spews negative externalities on your pension fund and passive savings by gaming a rules-based system. The only question is if Michael Lewis is gonna write a good book about this or be seduced into a bout of Stockholm Syndrome when he covers it.

Since you are going to hear so much about tax-loss harvesting a lot of it is guaranteed to be salesy. It’s an approach worth exploring but I’ll share substance* that recognizes the inherent tradeoffs and cost/benefit.

Here’s a few to get you started:

What They Don’t Tell You About Tax Alpha (8 min read)

Quorus is an upstart fintech player in the tax-loss harvesting arena. This article demonstrates how the devil is always in the details.

Direct Indexed Tax Loss Harvesting: Is the Juice Worth the Squeeze? (10 min read)

The Elm Wealth crew, as usual and welcome in our shiny object world, offer sober takes.

Tax Alpha Insider (Substack)

Brent Sullivan is a relentless investor advocate with the expertise and gall to dive into the details of financial products. His focus is on tax efficiency. I say gall because he’s like an investigative journalist in an industry where the incentives are to shill for a bigger pie in some new product area and hope to maintain your market share rather than waste energy debunking others’ marketing research.

You can search “tax-loss” on his substack and find lots of titles to titillate.


Money Angle For Masochists

More readers than normal found this week’s Path, VIX, & Hit Rates vs Expectancy highly educational. Coincidentally, that same morning Mark Phillips dropped Sympathetic Research which had significant overlap on the expectancy vs hit rate idea. He and I have been working on a project together in the background so some telepathy waves aren’t surprising!

If you are interested in options he’s a must-follow.

It’s paywalled but I also really enjoyed his recent Gulls for Bitcoin Bulls post part of his 50 Ways To Trade An Option series. He highlights some of the same things I’ve noticed and in fact talked about on our Moontower Community Zoom this week. He presents attractive pricing on the BTC option surface for people with a certain outlook. The problem I’m having is I want to do the opposite of the trade he highlights which means my idea is consensus and expensive. It’s a bummer for me, but also that’s the nature of trading — most of the time the thing you want to do should be baked. (A nice test of self-knowledge is to ask if you can tell the difference.)


From the mailbag

A moontower.ai user asked about oil volatility and correlation in the context of WTI and Brent crude. I did the editorial equivalent of showing him a cool scar:

Let me take these in turn.

USO is relatively illiquid these days relative to the futures options. It used to be more liquid. I spent the better part of a decade relative value trading it vs the futures options including doing create/redeems (I was constantly at OCC position limits — which have a horrible one-size-fits-all application).

Long-dated USO options are very interesting instruments because they are effectively long-dated options on a rolling CL1 contract. This is very different from say a 12-month futures option that references a less volatile CL12 contract.

This difference is why you can relative value trade it, but it’s a complicated model (actually I think a good interview question for a trader or quant is to come up with a model for this conceptually). It’s nice that it offers you an option chain on CL1 while the futures options don’t.

As far as Brent or for that matter heating oil and rbob which you didn’t ask about, the correlations to WTI change periodically when the fundamental details become bottlenecks in their respective markets. Refineries can’t just easily switch their slate between product grades so you can get over/under supply idiosyncracies. There’s an active “arb option” market which is options struck on the spread between WTI and Brent.

Further complicating matters is that Brent and WTI futures and futures options for a given month do not have the same expiries so when you do relative vol trades between them you end up with these residual calendar risks (brent options expiring a week earlier than WTI!)

There was a period of time where this is all I traded so to download all there is to say on this is impossible. You can make a career out of doing nothing else. If you like bloodshot eyes and your hair to be drained of youthful pigment of course.


Stay Groovy

☮️


Moontower Weekly Recap


Guest Post: Market Impact and Strategic Execution

Quant @imotw2 published Market Impact and Strategic Execution as an article on X.

With permission, I’m cross-posting it here. It turns execution inutition into market quantitative models. I’ll let the quants debate the models — my interest is in how well this post explains the actual dynamics of accessing liquidity, minimizing slippage, and leaking information with trade/bid/offer behavior.

Enjoy! 


The dirty secret of market impact? It’s messier than anyone admits. This article challenges conventional models by looking at how information actually flows through markets. Here’s the real problem: impact hits differently when you’re getting in versus getting out of positions – a fundamental asymmetry that most models miss entirely. Add in the fact that every major player’s algos are scrapping for the same liquidity, and traditional execution models fall apart.

By diving into the weeds of price formation and what drives liquidity providers, we crack open why impact behaves this way. The result? A framework that bridges pure theory and trading reality, giving you both the mathematical firepower and street-smart tools to optimize execution in markets.

1. Introduction

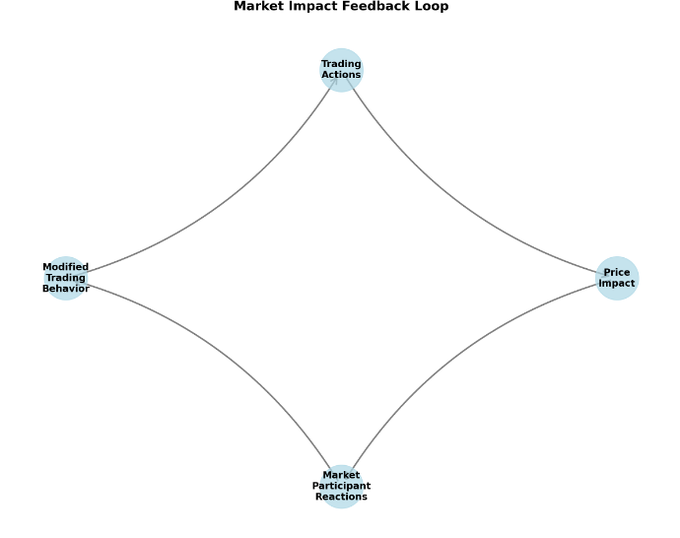
It’s the ultimate catch-22: you’re playing both sides of the impact game whether you like it or not. Every time you trade, you’re leaving footprints in the market while simultaneously trying to read everyone else’s tracks. Consider a large institutional trader executing a significant position. Each clip they trade isn’t just soaking up liquidity – it’s sending smoke signals to every shop watching the tape. The market sniffs out these patterns and adapts, forcing the trader to navigate the mess they’ve created for themselves. Talk about trading against your own shadow..

Impact also isn’t just about what you’re doing now – it’s about what the market thinks you’ll do next. Planning to unwind a monster position? Just prepping for it changes how you trade today.

You’re not the only one playing this game. Every decent-sized player is running their own book, trying to figure out your next move while hiding their own. Your optimal execution strategy? It depends on guessing their guesses about your guesses. Welcome to the hall of mirrors that is modern market microstructure.

2. Foundations of Impact

2.1 Beyond the Square Root Law

Everyone knows the square root law of impact – trade twice the size, eat about 1.4 times the slippage. But that’s not the whole story, actually its not even close. Markets aren’t this clean. Impact comes from a brawl between volatility feeding on itself, how fast the market digests your trades, and dealers trying to figure out if you know something they don’t. This changes how we need to think about moving size in markets.

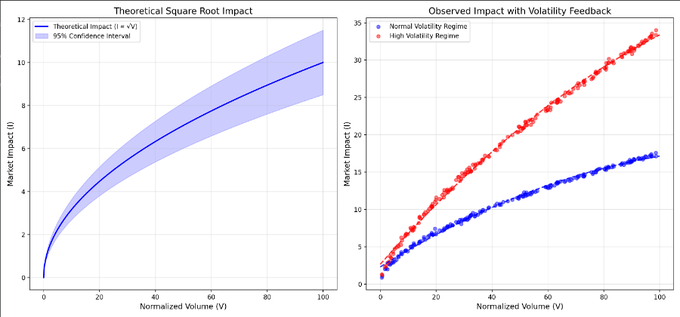
At the heart of our framework lies the recognition that trading activity both responds to and generates volatility. Consider a large institutional trader executing a significant position. Their trading consumes liquidity and reveals information, and also increases local volatility, that same volatility changes how the market reacts to their next trade. It’s like throwing stones in a pond where each splash affects how the next one ripples. Classic impact models completely miss this self-reinforcing cycle

Sure, cramming all this into one model is like trying to catch lightning in a bottle. But we’ve built something that tries to capture what we see in live markets.


This model implements the volatility feedback term:

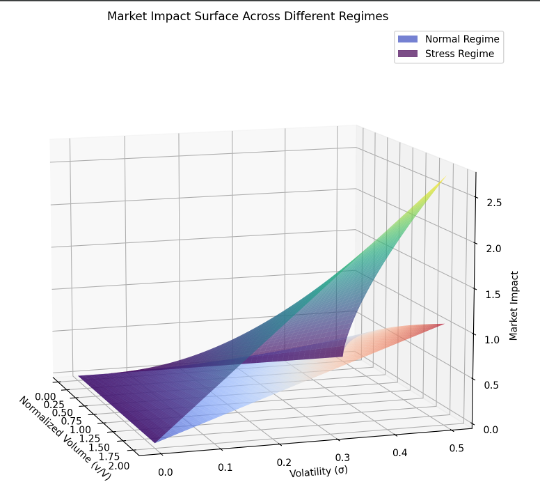
But we have to acknowledge some limitations. Trading isn’t as clean as the math suggests. That linear relationship between impact and vol feedback? Markets are messier than that. And β and γ(t)? They jump around – and good luck predicting when they’ll shift. And the volume-volatility interaction f(v)? Probably more complicated than we’re letting on. Plus, markets don’t slide smoothly between states – they snap.

So why bother with this framework? Because it gives us something concrete to work with. It nails the basic idea that impact and vol are stuck in this toxic relationship, and it actually works well in normal markets – which is most of the time. Run this during the 70-80% of trading days when markets behave, and you’ll get solid signals.

No model’s perfect. This one’s useful not because it nails every market move, but because it gives us a solid framework for thinking about how our trading pushes markets around and how markets push back. Use it to shape your execution strategy, but keep your eyes open – markets have a way of humbling anyone who thinks they’ve got them figured out

2.2 Ready, Set, Go!

Impact hits the market in three waves, and each one in its own way. Even in those first few milliseconds, when you’d think simple orderbook mechanics would rule everything, volatility’s already messing with you. Start working a big order, and the vol spike from your first fills immediately changes how the market handles your next batch.

Then things get interesting. Market makers aren’t just looking at your flow anymore – they’re betting on where vol’s heading because of it. You need to get your trade done, but you’re walking on eggshells trying not to kick off a vol spiral that’ll jack up your costs.

Here’s how it plays out in real time: You start hitting bids with size. Not only does price take a hit, but vol spikes. The market makers see this and think, ‘Great, vol’s about to rip – better back off these quotes.’ Now you’re stuck paying up even more for your next fills. Classic feedback loop that can turn a tough trade into a nightmare.

Long-term is where it gets really twisted. Trades that set off these vol feedback bombs? They tend to leave permanent marks on price. Why? Because the market’s reading these vol spikes as smoke signals – where there’s smoke, there must be fire. Throws the whole temporary versus permanent impact debate out the window. Instead, think of it like this: the bigger the vol feedback, the more likely the market thinks you know something they don’t. Price discovery through chaos, basically.

Our framework also reveals the strategic behavior of market makers and other liquidity providers. Their quote adjustment process now explicitly incorporates volatility feedback through a response function:

That λ(σ,t) term? That’s market makers getting twitchy when vol spikes. They’re playing a delicate game – dodge getting picked off versus making bank on those juicy vol-driven dislocations.

This flips everything we thought we knew about smart execution. You might actually want to take a bigger hit upfront if it keeps vol from spinning out of control. Sometimes you’ve got to pay the toll to avoid the avalanche.

We tested it briefly across equities, futures, and crypto. The model crushes it, especially during those nasty regime shifts when traditional models fall flat on their face. It nails the vol feedback effects, giving you a much better read on your true execution costs and how to optimize around them.

Bottom line? Impact isn’t just some tax you pay to trade. Every move you make reshapes the book for your next play. Once you start thinking about impact this way, whole new strategies open up. You’re not just minimizing cost anymore – you’re actively managing how your trades shape the market you’re trading in.

3. Information Theory of Execution

3.1 Order Flow Toxicity and Adverse Selection

The elephant in the room: toxic flow. Your algo’s (seeminly) crushing it, getting fills left and right – but is that actually good news? Could be perfect timing, or could be you’re getting picked off on stale quotes. Classic execution dilemma: go aggressive and risk getting fleeced, or sit back and watch alpha decay while everyone figures out what you’re up to.

We’re looking at how trades cluster in time and how order flow ripples across related products. Because let’s face it, when someone’s running a smart toxic arb, they’re hitting everything in the complex.

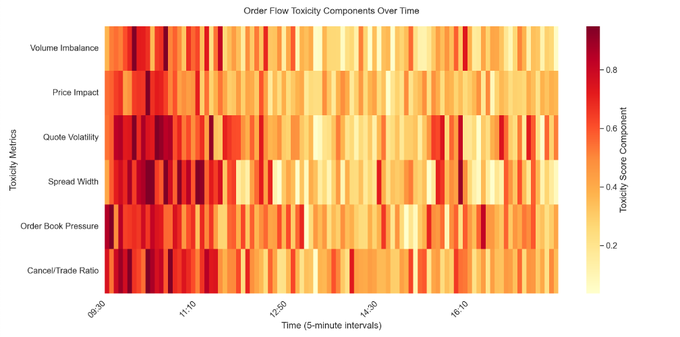
Here’s the math behind the magic – for a given order flow sequence, we compute the toxicity score T as:

Where V_i(t) represents the normalized volume in bucket i, C(t,i) captures the temporal correlation structure, S(t,i) measures cross-sectional spread dynamics and ω are weights that reflect market conditions.

This metric provides a measure of order flow toxicity that can be used to adjust execution algorithms’ aggression levels and venue selection strategies.

3.2 Learning and Adaptation

Modern execution algos are constantly learning – but there’s a catch. How do you know when the market’s actually changed versus when it’s just noise? Every trader’s been burned by overreacting to a head fake.

We tackled this by measuring what signals actually matter for execution. Forget trying to predict where prices are headed or cooking up the perfect schedule. Instead, we built a framework that attempts to cut through the noise to find what really drives execution quality.

Our framework splits market signals into three components:

  1. Structural information about liquidity conditions and market dynamics
  2. Temporary effects from specific order flow patterns
  3. Noise terms that should not influence execution decisions

For each signal, we measure how much juice (information ratio) it’s got like so:

where I(S; O) represents the mutual information between the signal and execution outcomes, and H(S) is the entropy of the signal. This tells us how much actual information we’re getting about execution outcomes versus how noisy the signal is. Translation? We can spot real market changes worth adapting to and ignore the head fakes that would otherwise trip us up.

3.3 High-Frequency Market Making and Latency Arbitrage

Evolving market structure has introduced a new layer in the interaction between execution algorithms and high-frequency traders. Your execution algo sees a fat stack of liquidity on the book – but good luck actually hitting it. Modern markets aren’t your grandfather’s NYSE floor where a handshake meant something. That liquidity? It in a way both exists and doesn’t exist until you try to trade it.

Imagine this: you spot 100,000 shares posted at the offer. Traditional models would tell you to size your child orders assuming that liquidity is actually there. Rookie mistake. Those quotes vanish faster than you can even start thinking about your next move. Market makers are running smart playbooks, adjusting their quotes every microsecond based on everything from correlated ETF moves to the temperature in New Jersey. Yeah, seriously.

What you see isn’t what you get. The odds of filling against posted liquidity aren’t just about time priority. This isn’t even academic hair-splitting – it changes how we need to think about modeling impact and designing execution strategies.

The displayed liquidity in the order book represents a conditional commitment that is fundamentally probabilistic in nature. This probability structure manifests through several key mechanisms:

Firstly, quotes don’t just sit there waiting to be hit. They dance. And not randomly – they move in patterns. When a big order hits, market makers don’t just pull their quotes at the affected price – they scatter like cockroaches under a kitchen light, repricing their entire book before you can blink. Why? Because they’re not idiots – they know one big trade usually means more are coming.

Secondly, What looks like a simple limit order is actually a war zone. That 100k share quote? It’s really multiple market makers playing chicken with each other, each one’s algo trying to figure out if the others know something they don’t. Meanwhile, every other trader with a similar strategy is trying to get to the same party.

Finally, there’s the speed game. By the time your order hits the exchange, that juicy quote you saw might be ancient history. We’re talking microseconds here, but that’s an eternity. Between your network latency, the exchange’s matching engine having its morning coffee, and Jump Crypto cooking you with their radio towers – well, good luck. Even if you’re fast, queue position is usually everything. Being second in line might as well be last when the music stops. The order book isn’t a menu, and if you’re modeling it that way, you’re bringing a knife to a gunfight.

We find that the likelihood of a quote remaining available for execution follows a more complex distribution than previously recognized:

Where λ(t,s) represents the base cancellation intensity that varies with both time and market state, τ(v,σ) captures the reaction time that varies with volume and volatility, and f(OFI, IMB) adjusts for order flow imbalance and book pressure. This creates an effective liquidity profile that differs markedly from the observed order book, forcing execution algorithms to operate in a probabilistic framework.

In English? The faster you need to trade, the bigger your order, or the more the market’s moving – the more likely that liquidity is gonna vanish before you get there. And if the order flow’s getting lopsided or the book’s getting thin? Forget about it.

The implications of this extend beyond simple quote availability. Market makers aren’t just watching your stock. They’re watching everything. Hit them too hard in SPY? Watch their quotes disappear in IWM before you can even think about going there. These guys are hunting for any sign that you’re about to unload size.

The presence of latency arbitrage opportunities introduces systematic biases in observed market impact that must be considered. Every microsecond of delay between exchanges is a gold mine for the right setup. While you’re still seeing stale quotes in Jersey City, someone’s already cleaned up in Mahwah. The really fun part? This isn’t just noise – it creates predictable patterns in how markets react and impact spreads. Those theoretical arb profits (αcross)? They’re like a fingerprint showing exactly how quotes are gonna move and where the impact’s gonna hit first.

Market manipulation remains a massive concern in markets, especially in crypto where it’s not just an edge case – it’s a daily reality you need to deal with. Quote stuffing, layering, and other manipulation schemes regularly distort impact measurements. By tracking specific order book patterns – quote stuffing intensity, layer depth stability, and price oscillations – we can build real-time manipulation indicators. This lets execution algorithms adapt dynamically, threading the needle between adverse selection and efficient trading paths.

Speed management is make-or-break in this environment. Every algo faces a core tradeoff: execute faster to dodge adverse selection, or slower to minimize information leakage. It’s an optimization problem where the sweet spot shifts constantly with market conditions, participant behavior, and execution objectives.

The data shows static speed strategies consistently underperform. Effective execution requires continuous adaptation based on market toxicity metrics, participant patterns, and market state. But nailing this in practice? That’s where things get interesting.

Implementation demands extreme precision at the infrastructure level. Microsecond-level clock sync isn’t a nice-to-have – it’s essential. One timing slip and your execution quality falls off a cliff. Network stacks need to handle the market data and order flow and how they interact, seamlessly. Risk controls need to maintain deterministic latency while actually protecting you. Memory management has to deliver rock-solid performance at the microsecond level.

4. Advanced Impact Modeling

4.1 Cross-Asset Impact Propagation

Trading ETFs or index futures? Your impact bleeds everywhere, and not in the neat way most risk models predict. Markets are connected through a nasty web that shift based on regime and time. Worse still, these relationships aren’t symmetric – the way impact flows from futures to stocks isn’t the same as stocks to futures, and good luck if volatility is spiking.

Here’s how we try to model this mess:

Where:

  • K_ij(t) represents the kernel function capturing lead-lag relationships (how moves in one market spill into another over time)
  • α_i(t) models time-varying direct impact sensitivity (how much bang for your buck you get in each market)
  • β_ij(S(t)) are state-dependent coupling coefficients (how strongly markets are linked, which changes with market conditions)
  • S(t) encodes market state including volatility regimes, basis levels, and order book conditions
  • φ(L_i, L_j, t) captures non-linear liquidity interaction effects (how liquidity dynamics in one market screw with impact in another)

The coupling coefficients β_ij(S(t)) follow a regime-switching process:

Where R(t) indicates the market regime based on a multivariate state classification incorporating relative volatility levels, basis spread dynamics, order book imbalances, trading volume ratios and market stress indicators.

The liquidity interaction term φ(L_i, L_j, t) models how the availability and cost of liquidity in one market affects impact propagation in related markets, which essentially ties it all together:

This captures several features absent from traditional correlation-based approaches

  1. Temporal lead-lag relationships through the integral terms
  2. State-dependent coupling strength
  3. Non-linear feedback effects
  4. Regime-switching behavior
  5. Cross-market liquidity interactions

If you’re trading across multiple markets, you need a model that deals with reality, not just correlation matrices and linear spillovers. This framework gives you the tools to handle the mess.

4.2 Queue Position Game Theory

The management of queue position in modern markets creates a game-theoretic problem. When placing passive orders, traders have to consider their position within the queue and the information content of their queue placement decisions. Every time you join a queue, you’re not just picking a spot in line, you’re sending signals to every other algo watching the tape. And trust me, they’re all watching.

Think your queue position is worth what your transaction cost model says? Think again. That premium spot at the top of the book might be fool’s gold when everyone’s running the same playbook. Or it could be pure alpha when the market’s choppy and other players are gun-shy.

You’ve got to price in the option value of that queue spot, factor in what your queue placement tells the market about your book, and figure out what everyone else’s queue dancing means.

5. Implementation

5.1 Engineering in High-Frequency

Developing excecution algorithms in the context of latency creates significant engineering challenges, that if you get wrong, will crushingly affect trading performance. First up: timestamp management. Sounds boring, right? It is, but it could the difference between making money and getting run over.

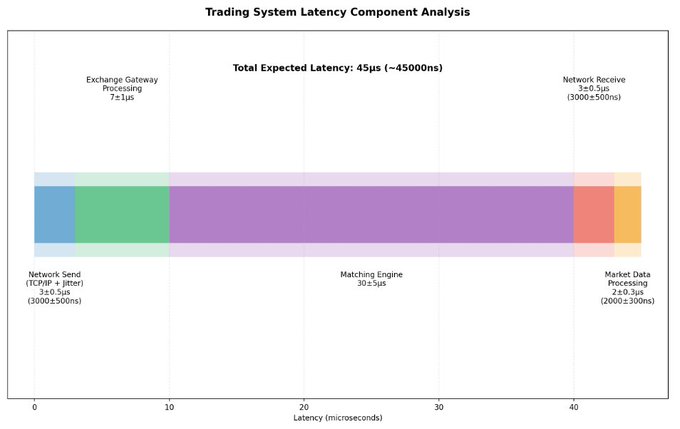
Here’s the thing about timestamps in modern markets – they’re a mess. That pristine timestamp you think you have? It’s about as accurate as a sundial here in Norway. When you’re building impact-aware algos, you need to know exactly when things happen, but that’s harder than it looks. Here’s what you’re really dealing with:

Where:

  • Δ_netword_send represents outbound network latency including TCP/IP stack and route-specific jitter. Hope you like randomness.
  • Δ_exchange captures exchange gateway processing time and order validation delays. Different by exchange, time of day, etc.
  • Δ_matching accounts for matching engine queueing and processing time. Where your order sits in the queue. Spoiler: not first.
  • Δ_network_recieve represents inbound network latency and potential packet loss recovery (So fun, said no one ever).
  • Δ_market_data includes feed handler latency and order book reconstruction time
  • Sum of epsilon sub i represents a composite error term incorporating:
  • Systematic variations in processing times
  • Random jitter components because why not
  • Regime-dependent uncertainty factors

This model creates option-like properties in order management. For example, the uncertainty in matching engine response times during high-volatility periods effectively grants a free option to other market participants, who can react to price movements before our timestamp uncertainty is resolved.

5.2 Risk Management Under Impact Constraints

Here’s where VaR gets interesting – and by interesting, I mean breaks down completely. You can’t just run standard VaR when your exit price depends on how fast you’re trying to get out. It’s a nasty circular problem: your risk depends on your liquidation strategy, but your strategy depends on your risk limits. Fun times…

We develop a modified risk framework that tries to account for these dependencies:

where E[I(Q, t) | Q, M] represents the expected impact given position Q and market conditions M. This allows for more realistic risk assessment and better integration of risk constraints into execution algorithms. Now your risk numbers might actually mean something.

6. So What? And Where Next?

We’ve built something that tries to bridge the gap between ivory tower theory and reality. By thinking about execution through the lens of information theory, we’re getting at how markets work.

Here’s the big takeaway, TL;DR if you will: stop thinking about impact as just a cost to minimize. It’s actually telling you something about how the market reads your flow and how other players are positioning against you. Once you get that, everything about execution strategy starts looking different.

It’s about making money and, more importantly, not losing it when things get ugly.

“A sale is made on EVERY call”

On Thursday I published a post called laying in the weeds, an expression I used regularly. Whether it was getting ready to pounce on an offer that accumulates suddenly, sniping with electronic eyes while streaming, or just keeping your mouth shut while others leak info, the lingo fits. It’s ultimately about execution — how do I get the price and size I want?

We can use that background to riff about execution which is easy but dangerous to develop lazy habits about (like laying in the weeds this is more of a professional topic because of the imperative to reduce slippage)

Here’s a common scenario in the voice option market.

Assumptions:

  • An option is worth $.90
  • A broker is bidding $.92 for 10,000 lots
  • You and 3 additional market makers are offering at $.94. You know this because the broker, who we will assume is honest, relayed the full picture.

The case of simple 2 choice scenario tree

  1. You hit the bid and get all 10,000. Expected profit = $.02 x 100 x 10,000 = $20,000
  2. Nobody breaks rank, the offer is lifted with 4 market makers getting equal allocation. Expected profit = $.04 x 100 x 2,500 = $10,000

Seems like you should hit the bid. Except for that, if you do, next time all the offers are more aggressive. Tit-for-tat mutually assured destruction.

You get an interesting result if you unravel the game theory. Assuming none of the market makers are particularly axed in the option, and they all have a similar hurdle rate on how much capital they are willing to deploy for some amount of risk/reward you end up with a stable equilibrium that looks similar to what pre-communicated collusion would have resulted in.

[Aside from the dinosaur era: The way to get a lightly capitalized newcomer to your options pit to give up and go home is demoralizing attrition — trade everything for fair until they go away. I even remember days as a clerk on the specialist post where the boss would tell me to offer something so cheap on our exchange to embarrass a specialist on another exchange who ripped off the buyer at a higher price. The away specialist could lift our lower offer and lock-in a profit but they wouldn’t want to because by forcing the print they would make the customer feel bad about their fill. And if they did lock in the profit by trading with us, we were more than happy to incinerate money to make the customer think twice about routing around us in the future. I can remember the boss, crossed arms, still as Vader: “Keep offering. Filled? Reload.”]

More than 2 choices

Realistically, there are many scenarios. The option could have traded $.92 or $.93 with similar splits even if the first trader who hits the bid thinks she is getting the full bid size, but the broker being a diplomat who needs to deal with each of the market-makers daily decides to split it 4 ways anyway at the lower price. This result is common and explains why it doesn’t make sense to break price. They are unlikely to get the benefit unless they clarify with the broker that they are only going to hit the bid if they get full size (the broker weighs whether they should box the other 3 out and consequently piss them off).

How this plays out depends on your business relationship to the broker both in terms of how much you pay them and how useful you are in making fast, tight markets. When I was a local on the NYMEX I didn’t trade huge size but I was super-responsive so I could get those 25 and 50 lot berries. Those tight markets were also useful to the brokers who could use them “cuff” a related market or fish for business. At the fund, my value in the ecosystem was size, so I had leverage in setting the price of a larger order (maybe I could convince the broker to make the splits 4k, 4k, 1k, and 1k where I’m one of the larger allocations) but didn’t get the small layup orders.

We can get bogged down in scenarios forever, but the point is that this little game is being played all day. In the voice market and the electronic algo logic of sophisticated market-makers. If I divide all my profits by how many contracts I traded I end up somewhere in the penny ballpark. That’s the margin. That’s the difference between tossing coins for fair and a highly profitable business. It also means, that without a lot of reps it’s hard to tell if you have an edge.

Let’s do another example of cat-and-mouse.

An option is quoted $.21-$.23

You think it’s worth $.25

What do you do?

The correct answer is “it depends”. The first step to building a model for solving this execution problem is to identify the dependencies.

A few off the top of my head:

  • If I lift, I make $.02 of edge on Y volume
  • If I join the $.21 bid, what’s the probability I get hit (therefore making $.04) and how much volume would I get? Handicapping this depends on if the matching engine is time priority or pro-rata as well as if there is any priority that derives from my designation (customer, pro customer, professional, and more)
  • If I bid $.22 and get hit I make $.03. But would that bid cause someone else to lift $.23s? I need some map of what other market observers think an option is worth.

Broadly, I need some priors about the distribution of what others think this option is worth based on existing bids/offers, the trades that have happened, and trades that have not happened (ie bids/offers that have been displayed but nobody cared on).

You could start with a simple equation.

P(getting hit) * volume when I get hit * edge to the bid_price= volume when I lift * edge to the ask_price

You can solve for P(getting hit) to find a breakeven for how often you’d need to get hit to compensate you for not lifting.

While this is stylized and simple it’s not an attempt to point to some abstract HFT optimization problem. It’s a reminder that reflecting on your execution techniques sharpens your thinking about trading, conditional edge, adverse selection. It’s less important for retail or if you don’t transact often, but for professionals and asset managers it is justifiably top-of-mind.

“A sale is made on EVERY call”

Remember Ben Affleck in Boiler Room:

And there is no such thing as a no-sale call. A sale is made on every call you make. Either you sell the client some stock or he sells you a reason he can’t. Either way a sale is made, the only question is who is gonna close? You or him?

Every time you trade with a broker someone gets the best of it. If you consistently get allocations for 60 contracts when you should have gotten 70 you are destroying 14% of your annual profit. Specialists and DMMs had rules about allocation quantities but there were also unwritten rules. You were expected to fight for even a single contract that you are “entitled” to and advocate forcefully for your interests constantly. The pugilism was built right into the training and culture. The stories of ruthlessness were culturally rewarded. As a junior trader, sticking it to a competitor or getting into a nose-to-nose screaming battle with a broker just to define boundaries was a way to earn stripes.

[This is not my native personality but you adopt what it takes. After all, the only point of this job is to make as much money as possible. Sure, the cost likely bore itself as chronic anxiety about work but only the most well-matched people get the luxury of getting paid and being comfortable. I don’t miss all the daily haggling but I did take it seriously since it was one of the most impactful contributions to profit for the reasons above.

One story I had brought to my attention in the past year — a PM who ran one of the large banks deriv desks reminisced about the AMEX when we were in the same pit. He’s a bit younger than me and apparently I made a big scene sticking up for him to a broker who tried to bully him in the pit. Nice to hear even though I don’t remember the exact incident. I do have a vague memory of lots of battles in that pit because it was a large crowd in a very liquid name.]

Final thoughts on this theme: if you manage a business that’s a game of inches, it’s good to periodically check-in and ask “are we clawing for those inches?

Is everyone at the point-of-sale aware of what needs to be done or are we getting sloppy? Are we leaking info? Are we too nice? Would it pay to be squeakier? Are we paying the brokers we want to be paying? Are we paying the brokers the right amount?

Evergreen:

the truth about online sports betting

The recent Economist lead article:

Meanwhile in reality:

I know it’s quaint in 2024 AD to let reality get in the way of a good story but this is what we know:

  • The online sports betting industry is a low-margin business with high customer acquisition costs (ie relentless advertising and bonus promos).
  • Like mobile gaming, most of the profits come from a small subset of customers. You can dress this up in VC-approved language: 80/20 rule, Pareto distribution, power law. But in gaming, these high-value customers are simply called “whales”. In sports betting, the right word is “addicts”.
  • The profits come from sick people who churn. And why must they churn? Because eventually, they go broke betting 4-leg parlays. What’s a 4-leg parlay? It’s a clinical term for when a gambling site connects a Dyson to your bank account.
  • If your best customers necessarily churn you have no choice except to hunt for more sick people and make sure you exact every last cent out of the ones you’ve hooked.
  • The entire regulatory backdrop is complicit in a gigantic lie — that this is a free market. But you’re not allowed to win. It’s a rigged game. If you have an edge they limit your bet sizes to lollipop levels.
  • The gambling 800 number PSA they include in the ads is weapons-grade irony. The business relies on the people who should be calling that number to instead believe that their luck is about to change for the better.
  • Any attempt to rebut the disgusting contradictions with rhetoric (nobody is going to defend their behavior honestly with data) must contend with reality — sharp bettors try to mimic addicts or blend in with edgeless whales to “get down” (lingo for being able to place adequate sized bets). That tells you everything about the industry’s sympathies towards addicts.

Anyway, I had no reason to bring any of this up except for the Economist cover being a cat’s paw for hyper liberal market ideology. There are plenty of examples of free trade being pro-sum. This one undermines the message. An impressive journalistic own-goal for a publication titled “Economist”.

Make me czar and I kill the current system. Instead…all betting is on an exchange. You bid and offer just like futures markets. It won’t solve addiction but now smart bettors are valuable and rewarded, everyone gets better prices, and the incentives are towards volumes not seeking out sick people to cross faded markets.

More reading:

The Online Sports Gambling Experiment Has Failed (14 min read)
Zvi Mowshowitz

While I’m just ranting, Zvi shows his work in a convincing argument.

[Zvi is a sports gambler and a former Jane Street trader. His discussion of trading in this interview with Patrick McKenzie is fun.

Zvi’s substack tends to be mostly focused on AI but he does deep dives on various topics. The recent one on the Jones Act is shockingly hard to put down. The subject would appear to be dry (no glancing pun intended with Jones being about water-borne trade) but Zvi brings it to life.]

Related:

✍🏽Takeaways from The Odd Lots episode with pro sports gambler Isaac Rose-Berman

✍🏽Classics that remind us that thinking in averages or bell curves is often dead wrong. In many domains, especially business, a small number of customers or products drive most of the outcome.

  1. Taylor Pearson’s How to Get Lucky: Focus On The Fat Tails (13 min read)
  2. Kevin Kelly’s 1000 True Fans (19 min read)

I didn’t read Kevin’s post in 2008 when it dropped but it turned out to be incredibly wise.

Moontower #251

Friends,

The recent Economist lead article:

Meanwhile in reality:

I know it’s quaint in 2024 AD to let reality get in the way of a good story but this is what we know:

  • The online sports betting industry is a low-margin business with high customer acquisition costs (ie relentless advertising and bonus promos).
  • Like mobile gaming, most of the profits come from a small subset of customers. You can dress this up in VC-approved language: 80/20 rule, Pareto distribution, power law. But in gaming, these high-value customers are simply called “whales”. In sports betting, the right word is “addicts”.
  • The profits come from sick people who churn. And why must they churn? Because eventually, they go broke betting 4-leg parlays. What’s a 4-leg parlay? It’s a clinical term for when a gambling site connects a Dyson to your bank account.
  • If your best customers necessarily churn you have no choice except to hunt for more sick people and make sure you exact every last cent out of the ones you’ve hooked.
  • The entire regulatory backdrop is complicit in a gigantic lie — that this is a free market. But you’re not allowed to win. It’s a rigged game. If you have an edge they limit your bet sizes to lollipop levels.
  • The gambling 800 number PSA they include in the ads is weapons-grade irony. The business relies on the people who should be calling that number to instead believe that their luck is about to change for the better.
  • Any attempt to rebut the disgusting contradictions with rhetoric (nobody is going to defend their behavior honestly with data) must contend with reality — sharp bettors try to mimic addicts or blend in with edgeless whales to “get down” (lingo for being able to place adequate sized bets). That tells you everything about the industry’s sympathies towards addicts.

Anyway, I had no reason to bring any of this up except for the Economist cover being a cat’s paw for hyper liberal market ideology. There are plenty of examples of free trade being pro-sum. This one undermines the message. An impressive journalistic own-goal for a publication titled “Economist”.

Make me czar and I kill the current system. Instead…all betting is on an exchange. You bid and offer just like futures markets. It won’t solve addiction but now smart bettors are valuable and rewarded, everyone gets better prices, and the incentives are towards volumes not seeking out sick people to cross faded markets.

More reading:

The Online Sports Gambling Experiment Has Failed (14 min read)
Zvi Mowshowitz

While I’m just ranting, Zvi shows his work in a convincing argument.

[Zvi is a sports gambler and a former Jane Street trader. His discussion of trading in this interview with Patrick McKenzie is fun.

Zvi’s substack tends to be mostly focused on AI but he does deep dives on various topics. The recent one on the Jones Act is shockingly hard to put down. The subject would appear to be dry (no glancing pun intended with Jones being about water-borne trade) but Zvi brings it to life.]

Related:

✍🏽Takeaways from The Odd Lots episode with pro sports gambler Isaac Rose-Berman

✍🏽Classics that remind us that thinking in averages or bell curves is often dead wrong. In many domains, especially business, a small number of customers or products drive most of the outcome.

  1. Taylor Pearson’s How to Get Lucky: Focus On The Fat Tails (13 min read)
  2. Kevin Kelly’s 1000 True Fans (19 min read)

I didn’t read Kevin’s post in 2008 when it dropped but it turned out to be incredibly wise.

On a related note, I owe you a thank you. Crossed 15k this week. The letter resumed strong growth, similar to early 2022, before the Twitter algo devalued my use of it by suppressing outside links, esp substack. Growth this year was brute force — I never wrote so much as in 2024.

Most importantly thank you for the privilege of not letting me talk to myself any longer than I already do.


Money Angle

A couple things upcoming this week.

Kris Longmore at Robot Wealth whose incredibly enlightening and generous story I boosted in case study on becoming a partner at a trading firm is hosting me for a live AMA with his community this Wednesday.

🤖Sign up here

If anyone asks me about BTC I’ll discuss my frustration with this dynamic in the option market (that’s a tell by the way):

In English, the tweet shows how IBIT is trading richer via the options than the cash price of IBIT shares. That means if you buy the IBIT synthetic future via the options you’ll underperform just buying IBIT. Likewise if you short the synthetic you will outperform an IBIT short.


Money Angle For Masochists

On Thursday I published a post called laying in the weeds, an expression I used regularly. Whether it was getting ready to pounce on an offer that accumulates suddenly, sniping with electronic eyes while streaming, or just keeping your mouth shut while others leak info, the lingo fits. It’s ultimately about execution — how do I get the price and size I want?

We can use that background to riff about execution which is easy but dangerous to develop lazy habits about (like laying in the weeds this is more of a professional topic because of the imperative to reduce slippage)

Here’s a common scenario in the voice option market.

Assumptions:

  • An option is worth $.90
  • A broker is bidding $.92 for 10,000 lots
  • You and 3 additional market makers are offering at $.94. You know this because the broker, who we will assume is honest, relayed the full picture.

The case of simple 2 choice scenario tree

  1. You hit the bid and get all 10,000. Expected profit = $.02 x 100 x 10,000 = $20,000
  2. Nobody breaks rank, the offer is lifted with 4 market makers getting equal allocation. Expected profit = $.04 x 100 x 2,500 = $10,000

Seems like you should hit the bid. Except for that, if you do, next time all the offers are more aggressive. Tit-for-tat mutually assured destruction.

You get an interesting result if you unravel the game theory. Assuming none of the market makers are particularly axed in the option, and they all have a similar hurdle rate on how much capital they are willing to deploy for some amount of risk/reward you end up with a stable equilibrium that looks similar to what pre-communicated collusion would have resulted in.

[Aside from the dinosaur era: The way to get a lightly capitalized newcomer to your options pit to give up and go home is demoralizing attrition — trade everything for fair until they go away. I even remember days as a clerk on the specialist post where the boss would tell me to offer something so cheap on our exchange to embarrass a specialist on another exchange who ripped off the buyer at a higher price. The away specialist could lift our lower offer and lock-in a profit but they wouldn’t want to because by forcing the print they would make the customer feel bad about their fill. And if they did lock in the profit by trading with us, we were more than happy to incinerate money to make the customer think twice about routing around us in the future. I can remember the boss, crossed arms, still as Vader: “Keep offering. Filled? Reload.”]

More than 2 choices

Realistically, there are many scenarios. The option could have traded $.92 or $.93 with similar splits even if the first trader who hits the bid thinks she is getting the full bid size, but the broker being a diplomat who needs to deal with each of the market-makers daily decides to split it 4 ways anyway at the lower price. This result is common and explains why it doesn’t make sense to break price. They are unlikely to get the benefit unless they clarify with the broker that they are only going to hit the bid if they get full size (the broker weighs whether they should box the other 3 out and consequently piss them off).

How this plays out depends on your business relationship to the broker both in terms of how much you pay them and how useful you are in making fast, tight markets. When I was a local on the NYMEX I didn’t trade huge size but I was super-responsive so I could get those 25 and 50 lot berries. Those tight markets were also useful to the brokers who could use them “cuff” a related market or fish for business. At the fund, my value in the ecosystem was size, so I had leverage in setting the price of a larger order (maybe I could convince the broker to make the splits 4k, 4k, 1k, and 1k where I’m one of the larger allocations) but didn’t get the small layup orders.

We can get bogged down in scenarios forever, but the point is that this little game is being played all day. In the voice market and the electronic algo logic of sophisticated market-makers. If I divide all my profits by how many contracts I traded I end up somewhere in the penny ballpark. That’s the margin. That’s the difference between tossing coins for fair and a highly profitable business. It also means, that without a lot of reps it’s hard to tell if you have an edge.

Let’s do another example of cat-and-mouse.

An option is quoted $.21-$.23

You think it’s worth $.25

What do you do?

The correct answer is “it depends”. The first step to building a model for solving this execution problem is to identify the dependencies.

A few off the top of my head:

  • If I lift, I make $.02 of edge on Y volume
  • If I join the $.21 bid, what’s the probability I get hit (therefore making $.04) and how much volume would I get? Handicapping this depends on if the matching engine is time priority or pro-rata as well as if there is any priority that derives from my designation (customer, pro customer, professional, and more)
  • If I bid $.22 and get hit I make $.03. But would that bid cause someone else to lift $.23s? I need some map of what other market observers think an option is worth.

Broadly, I need some priors about the distribution of what others think this option is worth based on existing bids/offers, the trades that have happened, and trades that have not happened (ie bids/offers that have been displayed but nobody cared on).

You could start with a simple equation.

P(getting hit) * volume when I get hit * edge to the bid_price= volume when I lift * edge to the ask_price

You can solve for P(getting hit) to find a breakeven for how often you’d need to get hit to compensate you for not lifting.

While this is stylized and simple it’s not an attempt to point to some abstract HFT optimization problem. It’s a reminder that reflecting on your execution techniques sharpens your thinking about trading, conditional edge, adverse selection. It’s less important for retail or if you don’t transact often, but for professionals and asset managers it is justifiably top-of-mind.

“A sale is made on EVERY call”

Remember Ben Affleck in Boiler Room:

And there is no such thing as a no-sale call. A sale is made on every call you make. Either you sell the client some stock or he sells you a reason he can’t. Either way a sale is made, the only question is who is gonna close? You or him?

Every time you trade with a broker someone gets the best of it. If you consistently get allocations for 60 contracts when you should have gotten 70 you are destroying 14% of your annual profit. Specialists and DMMs had rules about allocation quantities but there were also unwritten rules. You were expected to fight for even a single contract that you are “entitled” to and advocate forcefully for your interests constantly. The pugilism was built right into the training and culture. The stories of ruthlessness were culturally rewarded. As a junior trader, sticking it to a competitor or getting into a nose-to-nose screaming battle with a broker just to define boundaries was a way to earn stripes.

[This is not my native personality but you adopt what it takes. After all, the only point of this job is to make as much money as possible. Sure, the cost likely bore itself as chronic anxiety about work but only the most well-matched people get the luxury of getting paid and being comfortable. I don’t miss all the daily haggling but I did take it seriously since it was one of the most impactful contributions to profit for the reasons above.

One story I had brought to my attention in the past year — a PM who ran one of the large banks deriv desks reminisced about the AMEX when we were in the same pit. He’s a bit younger than me and apparently I made a big scene sticking up for him to a broker who tried to bully him in the pit. Nice to hear even though I don’t remember the exact incident. I do have a vague memory of lots of battles in that pit because it was a large crowd in a very liquid name.]

Final thoughts on this theme: if you manage a business that’s a game of inches, it’s good to periodically check-in and ask “are we clawing for those inches?

Is everyone at the point-of-sale aware of what needs to be done or are we getting sloppy? Are we leaking info? Are we too nice? Would it pay to be squeakier? Are we paying the brokers we want to be paying? Are we paying the brokers the right amount?

Evergreen:

Stay Groovy

☮️


Moontower Weekly Recap

Tax-Loss Harvesting On Levered Long/Short

Real estate people understand the value of accounting losses in service of deferring taxes while an asset’s returns compound.

In the institutional investing world many investors such as endowments are tax-exempt.

Retail investors in public stocks have less places to hide outside of tax-advantaged accounts which are hard to jam lots of assets into in the first place.

The rise of ETFs have come with some relief on the tax side as you decide when to pay taxes because you decide when to sell even as the holdings are rebalanced. Mutual funds can leave you footing a prorated portion of the pool’s taxes regardless of how long you’ve been an investor.

While the ETF advantage is real it’s relatively minor compared to the ability to tax-loss harvest. By owning the individual components of a stock index you can sell losers, rebalance into peer stocks, and accumulate short-term losses to offset long-term capital gains on the subset of names that moon.

I say minor because of the “brain damage” (more effort, slippage, tracking error although if it’s random only matters if you’re managing money for others) and higher management fees associated with TLH. See Alpha Architect’s The Costs and Benefits of Tax-Loss-Harvesting (TLH) Versus an ETF.

Another restraint on TLH enthusiasm is limitation on writing off losses greater than $3,000 per year. Losses are more valuable in an NPV sense if you can use them to offset significant capital gains when diversifying out of a large gain in a concentrated position. With markets where they are, especially the Mag 7 and BTC, this is common high-class problem.

Still, the fintech world with the rise of robo-advisors and software is enabling both retail and advisors to “direct index” making TLH both easier and less costly.

Getting a sense of proportion

Let’s do some simplistic hand-wavey math to get a sense of proportion for how TLH might work if you were simply long a $1mm basket of stocks.

Assuming individual stocks were i.i.d. (“independent and identically distributed”) with expected mean monthly return of 0 and standard deviation of 10% (10% *√12 ~ 35% annual estimate of single stock volatility) then conditional on a stock being down its expected loss is 6.75%

This is symmetrical. Given that a stock is up the average expected return is +6.75%. We are just using arithmetic returns.

In mathematical expectation you expect the portfolio p/l to be 0, with half the stocks up and half down. Thinking about the portfolio as 2 halves, you expect $500k to earn 6.75% or $33,750 and $500k to lose $33,750.

Now suppose you rebalance the losers into a Wario basket of names that have the same exact characteristics as the ones we sold. You have now crystallized $33,750 of short-term tax losses but our exposure is the same. You have gained an asset to offset future tax liabilities.

Just staying simplistic, if all the stocks proceed to go up by 5% over the next 365 days and you sell on day 366 to get LTCG treatment (assume 23.8% — which is just Federal!) then what is your after tax return?

Winning stocks:

$533,750 * 1.05 = $559,728.75 or $59,728.75 total profit on a basis of $500k

Losing Stocks:

$466,250 * 1.05 = $489,562.50 or $23,312.50 profit on a basis of $466,250

resulting in:

+$83,041.25 LTCG (5% on $1mm exposure)

-$33,750 short term losses

= taxable gain of $49,291.25

tax bill = 23.8% x $49,291.25 = $11,731.32

After cutting the check what do you have in your account?

$1,049,291.25 – $11,731.32 = $1,037,559.93 or a 3.75% after-tax return.


💡The tax benefit

You’ll notice that if you bought $1mm of an ETF that went up 5% in a year and sold on day 366 your $50,000 profit less 23.8% taxes would net you about the same after-tax return.

So where’s the benefit?

It’s in the optionality of this pool of short term losses that you have control over. You could just let this $1,050,000 portfolio grow and keep the short-term losses as an asset in your back pocket to use against future tax liabilities, some of which are going to be taxed higher than LTCG rate. Alternatively if you need to divest a large chunk of a profitable position to raise cash, you’ll have a large pool of losses to offset the gain.

The real value of TLH emerges when:

  • Offsetting Higher Tax-Rate Gains
    • Short-term capital gains (STCG) or ordinary income are taxed at higher rates than LTCG. If your harvested losses offset STCG or ordinary income, you reduce your taxes significantly.
  • Perpetual Deferral
    • Step-Up in Basis
      • If you hold the portfolio until death, the heirs may receive a step-up in basis, erasing deferred taxes entirely.
    • Charitable Contributions:
      • Gains on low-basis positions can be avoided by donating appreciated securities to charity.

This toy example is compelling enough to realize it’s important. But there’s also another flavor of TLH on the scene with the potential to generate significant short-term accounting losses while the overall value of the portfolio grows.

TLH on levered long-short portfolios held in a separately managed account (SMA)

Using portfolio margin and a quant framework (this can range fairly basic to factor-intensive), an investor can run the same beta they desired in a typical long-only ETF but generate significant short-term losses by using their stocks as collateral to overlay a long-short portfolio.

This is typically done with an advisor who will in turn be using a sub-advisor whose infrastructure allows them to scale portfolio adjustments across thousands of custom custom portfolios held in SMAs.

I’ve heard some claims of how much more impactful this can be but again it’s critical to sanity check with actual numbers to make sure the sense of proportion is reasonable. From there you start layering common caveats which are easier to handicap in terms of bps per year.

In this case, the sanity checks called for simulation.

A little foreshadowing — if you are in a high tax bracket or trying to work out of a concentrated position with a low cost basis you are going to want to see this.

You get the simulation code, you can run it in your browser and it will even download the full output. I’ll show you a few manipulations for the output so you can get a strong grasp on the mechanics. This is one of those concepts that you can’t unsee once you see it. Multiple bulbs going on at the same time.

(It’s also quite depressing so much time is spent on taxes and the ROI on that time is validated by the math. Both taxes and the time spent on their minimization is deadweight loss. I like markets, I hate structuring and law and tax and basically all the crap that’s probably higher yield to understand. And just going through this exercise depressed me even further because it confirmed how important it is.)

Onwards…

This Jupyter notebook can be run directly in the Google Colab environment.

🔗TLH.ipynb

Open the link and press “play”.

The output will:

Return a summary in the browser of the simulation results

download a CSV to your browser


Stepping through the tax-loss harvesting (TLH) simulation

This simulation models a tax-loss harvesting strategy applied to a hypothetical stock portfolio over a 12-month period. The objective is to demonstrate how TLH can potentially reduce taxes by systematically harvesting losses on individual stocks while maintaining the portfolio’s market exposure.

Key Steps and Mechanics of the Simulation

  1. Portfolio Setup: $1mm long equity portfolio
    • The portfolio consists of two parts:
      • Long Positions: $1,300,000 allocated across 100 individual stocks.
      • Short Positions: $300,000 allocated across another 100 individual stocks.
    • Each stock in the long portfolio has a starting price of $100 and is equally weighted. Each stock in the short portfolio also has a starting price of $100 and is equally weighted.
  2. Return Simulation:
    • Every month, the returns for each stock are randomly and independently generated based on a normal distribution with:
      • Mean Return: .80% per month (approximately 10% annualized compound return).
      • Volatility: 10% per month
  3. Monthly Rebalancing for Tax-Loss Harvesting:
    • Harvesting Criteria: At the end of each month, the simulation checks each position to see if it meets the tax-loss harvesting criteria.
    • Long Positions: If the price of a long stock falls below its cost basis ($100), the position is “harvested.”
      • Harvesting Process:
        • The position is closed, and the realized loss is calculated based on the difference between the cost basis and the current price.
        • This loss is recorded as a crystallized loss, and the realized loss amount is added to the cumulative short-term losses for the portfolio.
        • A new stock is bought in its place with a fresh cost basis of $100 using the harvested amount. Since the original position suffered a loss, the proceeds will be less than $13,000 ($100 * 130) worth of shares. Since the new stock is also $100, the share quantity must be less than 130.
    • Short Positions: If the price of a short stock rises above its cost basis ($100), the position is similarly harvested.
      • Harvesting Process:
        • The position is closed, realizing a loss based on the difference between the cost basis and the current price.
        • This loss is recorded as a crystallized loss, and the amount is added to the cumulative short-term losses.
        • A short position in a new name is established to match the notional amount of the covered position. A fresh cost basis of $100, but the short share quantity will necessarily be less than 30 shares.
    • No Harvest for Profitable Positions: Positions that remain above (long) or below (short) their cost basis are not harvested and continue with their updated prices and fixed share quantities into the next month.
  4. Tracking Results:
    • For each month, the simulation tracks:
      • Monthly Short-Term Losses: The sum of all realized losses from harvested positions within the month.
      • Cumulative Short-Term Losses: The running total of all realized losses harvested up to that point in the year.
      • Monthly Tax Benefit: Calculated as the monthly short-term losses multiplied by a specified long capital gains tax rate (assumed to be 23.8%) since that’s what they will be used to offset.
      • Cumulative Tax Benefit: The running total of tax savings from all harvested short-term losses over the year.
  5. Assumptions:
    • Consistent Cost Basis: Each new position, whether long or short, always has a fresh cost basis of $100, regardless of the prior stock’s price at liquidation.
    • Monthly Frequency: The portfolio is evaluated and rebalanced for TLH at the end of each month, meaning opportunities to harvest losses are considered 12 times over the year.
    • Independent Stock Movements: Each stock’s returns are generated independently of others, with no correlation among stock prices.
    • Equal Allocation and Reinvestment: Both the long and short portfolios are equally allocated across the stocks, and any harvested amount is fully reinvested into a new position with the same initial investment amount.
    • Static Portfolio Size: The portfolio maintains 100 long and 100 short positions, with new stocks replacing harvested ones to keep the portfolio composition stable.
  6. Output:
    • At the end of the simulation, the following information is displayed:
      • Detailed Monthly Summary Table: Includes individual stock performance, crystallized losses, and other details for each stock every month.
      • Month-End Summary: Shows monthly and cumulative short-term losses and tax benefits. This provides insights into how the strategy’s tax benefits accumulate over the year.
      • Overall Portfolio Statistics: Total portfolio gain/loss, gross return, accumulated short-term losses, and the final tax benefit as a percentage of the initial portfolio value.

Summary

I address a few of the real-world considerations further below.

But to put the value of this concisely:

Making a $100k capital gain on an investment is not as useful as making $300k with $200k of short-term losses even though the net is the same.

[Notice how you might not have enough capital gains to take advantage of all these short-term losses. Which is why a strategy like this is especially useful for investors sitting on concentrated profits — they can work out out of it much with smaller tax impact. Holdings can be used to collateralize shorts with portfolio margin!]

Real World Considerations

  • In practice, a TLH strategy would seek to rebalance into names with similar characteristics (whether by factor, sector etc) to avoid wash-sale rules. In the simulation each stock has the same vol but this proxies using equal-vol weighting in the real world.
  • There is a cost of leverage although it is partially offset by the short-stock rebate on shorts.
  • Note that as the market rises, the number of positions that are underwater declines. Names you recently rebalanced into will have a better chance to experience loss to harvest than a name that you have been holding for years of a bull market. However the levered version of TLH which includes shorts and longs offers far more opportunity to harvest than a long only portfolio which might have very few losers after several years.
    • As time passes the surface area for loss harvesting stabilizes towards something of a steady state.
  • The strategy is meant to maintain a 100% long exposure (130 long vs 30 short) so if volatility increases it is still bad news. But the tax loss harvesting portion can actually benefit from higher volatility so there’s a natural buffer.
  • Monthly turnover means slippage costs. Those will increase with volatility.

Wrapping up

I leave it to you to decide how interesting this all might be.

(I find it compelling but still taking it apart.)

I’m not a tax expert. I’m not a simulation expert. Hell, it was a long battle with ChatGPT to get that code to a place that felt right. (It was about 50 iterations of “run code”, “pivot table the CSV data”, “see if the lifecycle of trade/rebalance/accounting made sense”, “tell ChatGPT how the desired behavior of the code diverged from the actual behavior”, “repeat”).

Example of stitched together images of pivot tables to investigate:

  • This one allowed me to see crystallized losses by month. You can see how they decline over time. That’s because as the market rises the further stocks are above their cost basis which means less opportunity for harvesting. This would be much more pronounced if there you did not employ shorting.

This table lets you see price paths


Position and portfolio values over time

I hope some of you will get your hands dirty with this as well. I want to know what I’m missing or flat-out misunderstanding. Even placing sane error bars around the real-world considerations would be helpful.

Option Spellbooks

When you learn a new language you ascend levels of competence. You start with everyday words and basic grammar with a goal of at least being comprehensible. This will unlock simple conversations, a milestone that enables and encourages regular practice. Like getting through the first month of guitar when you just wrestle with physical finger placement and learning your A, E, G, C, D open chords. The moment you can fluidly switch between the chords you can play the majority of music you hear on the radio. That’s when your learning takes off.

With enough practice in language or music you can think outside your native tongue or improvise in real-time. In skill acquisition terms, you have achieved “unconscious competence”.

Options are the language of risk

You start by mapping basic vocabulary to real-world sensation. “Long call” = “happy if stock go up”. With practice, you develop taste in how to use this vocabulary. In English, “I know how you feel” expresses empathy but you don’t say that to someone who just lost a loved one both because it’s not true (you don’t know how they feel) and because this comment awkwardly makes the moment about you. Well-intentioned commiseration clumsily executed.

Trade structuring can be clumsily executed too. You think something could double in the next 6 months and you…sold puts? If you are right, congratulations on making a tiny bit of cash on direction but opportunity costing yourself a small fortune by expressing the trade with a short vol position when your entire thesis insinuates orgasmic levels of vol!

You touched options without understanding that they are always about vol. Like knowing the words but not how to use them. You’re still stuck at “unconscious incompetence”.

Before you go further it will take 4 minutes to review this idea directly…see Translating to “option surface” language

Wizardry

You have a book of spells. You desire stealth so you look up “cloak of invisibility” and see you need some a salamander tail, a runestone and peroxide to conjure it. Common ingredients in a sorcerer’s home.

In investing you have a sense that a stock is “probably going higher but if I’m wrong I’m really wrong.” That’s a natural language description of a somewhat routine scenario. You need to translate that to code. Option code.

  • What instrument is levered to the “probability that a stock goes up”?
  • What instrument is levered to “if down, magnitude is yuuuge”?
    • far OTM put

So the package of “probably going up, but if down, then down big” can be represented in option language as “long a call spread plus a teeny put”.

That’s the name of the spell.

Now, as a wizard you can adjust the size, ratio, and particular strike to both

a) suit your taste and

b) take “what the option market is giving you”.

What the option market is giving you

This ties right back to the most underappreciated concept in trading….is it bid or offered?

If you believe that an asset’s upcoming moves are distributed so it probably goes up but if not it crashes, you know what spell to cast. That’s half the battle.

Next question:

Is the option market offering you the ingredients for the spell at an attractive price? Or is every wizard trying to cast the same spell and bidding for the same ingredients?

We are going to look at a couple spells and their cost of ingredients.

You’ll learn how to measure price, decompose recipes, and if you read between the lines you’ll notice — even when no trade is indicated you receive a valuable update to your assumptions or an opportunity to express the bet in a way that exploits the price anomaly. There’s a beautiful yin and yang to options. If the cost of a one spell gets expensive there’s a counterspell that gets cheaper with respect to your view!

Let’s get to some data.

Setup

We are going to look at 2 spells that can make sense for betting on “probably going up, but if down, then down big”. An interesting thing about this distribution how its kinda the base case distribution for SPY right? Both history and the options market agree that the SPY proposition looks like “hey you’ll make some money on average and every now and then there will be a big drawdown. also, don’t expect the market to crash up overnight”.

[💡That fact in itself is useful because if you think another market conforms to that distribution you know how the SPY option market prices that spell! You may even adopt a prior that the SPY price for that spell could be an upper-bound or be considered “expensive” if another asset started trading that way. If that’s hard to understand, don’t sweat it, it’s a slightly more advanced inference that a relative value trader might make.]

We are going to price the spells and look at charts.

  • Our universe will be: SPY, TLT, GLD, USO and BITO
  • Our date range is almost 4 years (Jan 2021 – Nov 15, 2024…except for BITO which start 10/21)
  • We are looking at the closest listed expiry to the 90-day maturity (based on what option chains are listed there is about 15% tolerance on DTE around 90 but BITO chains are more sparse so DTE can vary by as much as 30 days or 33% tolerance)
  • We are choosing strikes closest to breakpoints that are 1 or 2 standard devs OTM depending on the spell. If we measure strike distance with standard deviation we are using the ATM vol to define the SD. So if 2 assets are both $100 a 1 standard deviation OTM call will be further away (ie a higher strike) in the higher vol asset. This concept is detailed in these series of posts:

There will be lots of little observations along the way so in the spirit of “enough with the rulebook, let’s just play”, we’ll proceed.

Learning the method via SPY

The first spell we’ll examine is a package of:

1-s.d. / 2-s.d. call spread

+

2-s.d. OTM put

measured as a percentage of the spot price.

For example, on 1/12/2021 the details were:

The package cost 1.16% of the spot price on that day.

Exploring the long call spread + long far OTM spell

Let’s move on to charts. I will point out notable features of each chart. I’ll point out the bits of learning in each one.

Chart 1

🌙The red line is the price of the package. It ranges from about 70-150 bps for a 3-month expiry

🌙The blue line is the ATM call as a percentage of spot. If you remember the straddle approximation formula you know that by dividing the spot price out this measure will track implied volatility.

🌙The package is long volatility (you lay out premium for it) so it’s not surprising that its price is correlated with the vol level. You also see that the package price itself varies between something like 20% and 50% of the ATM call value. When vol is low, it’s a higher percentage of the call price. Ponder that for a moment. It means OTM options are a bit “stickier”. Skew as a percentage of ATM vol (aka ”normalized skew”) flattens as vol increases and steepens as vol softens. We’ve talked about before in the context of conditioning skew percentiles on vol levels by using scatterplots to see that skew has a curved relationship to vol.

Chart 2

🌙Same data in scatterplot form. You can see the correlation clearly (r = .76). Red dot is the recent observation (11/15/24). The package price is high compared to the vol level. I don’t like to anthropomorphize markets and say “the vol surface agrees with the statement that the market is likely to go up but if not crash” but the price of that expression or spell is high. The market is not offering it cheaply.

Chart 3

🌙Lots of smoothing — dark red line is the 200d moving avg of the package. The dark pink is the rolling 200d standard deviation of the package price. Dashed pink is the 200d MAD (mean absolute deviation — just another measure of deviation. If it’s close to .80 then the distribution of the stat is close to normal, if it’s less it’s fatter tailed. It costs nothing to add this metric so I tend to do it whenever I look at a standard dev just in case there’s a disparity from .80. The dashed light blue line shows that its stable at .80 even if it’s hard to see on that axis).

🌙The dark blue dashed line is the z-score of the observation vs a 200 day lookback. You can see the spike on 8/5/24

Chart 4

🌙I was just curious so I threw up a scatter of the package price vs the trailing 1-week return. It gets cheaper when the market rallies but that’s just the spot-vol effect. On large moves either way it does look like there’s some modest smile effect where even on a large up move the package is more likely be on the more expensive side. Maybe the most interesting part of the chart is the X-axis itself. You can see the left skew of weekly returns. There are more large up moves than down moves but 2 largest moves are negative and out of bounds compared to the rest of the blob.

Decomposing the spell: the price of the ingredients

Let’s look at the building blocks of the spell to see what’s driving the value of the package.

🌙In 2022, the bulk of the package price was driven by the far OTM put. But you can see some small stretches like October 2022 when equity markets bottomed for the year (lows that haven’t been touched since) where the call spread was actually more expensive than the puts! We’ll chart the ratio of the package to the ATM call price directly to see that the package got cheap relative to the vol — again the skew flattening (shaded region was Oct 2022 lows). In this case, it was the put skew especially that got hammered.


[I remember 2022 in vol markets as the year tail and defensive strategies massively underperformed because funds had boughts puts at the end of 2021, a frothy year in from which a sell-off was actually consensus. If a sell-off is stabilizing, and restores order to the force, the skew is not gonna perform.

Markets are biology not physics he shouts into the void. It’s poker all the way down. Notice how I don’t try to create rules from what has happened or play technical analysis. I just look for prices that are anomalous, which doesn’t mean wrong, it just means it deserves attention. From there you have to like think and stuff. Get used to sitting in paradox. There is no closure. Markets are utterly indifferent to your need for coherence.

For what it’s worth a similar setup happened in late 2018 — vols ripped into the Q4 sell-off but skew got crushed because of a large overhang of recycled downside vega from the autocallable structured products. There was an inflection point in the open interest though so a clever cat would realize you could load up on the hated, supplied region of the skew because the market’s outstanding vega profile would flip on a second leg down (ie well supplied to flat).

So what do you do there? One thing that you can do (and it worked) was buy the puts and hedge on a heavy delta in expectation of a rally. If it rallies, you win on the outsize delta plus the puts sliding up the skew curve as they become further OTM. If the market sells off into the abyss where the open interest and market-wide greeks quickly decay you are long vega into an exploding vol market. It was one of the easier risk-reward setups that comes along every now. I know I’m gonna get emails from retail traders asking about how you can plug into this and I’ll just preempt it now. You can’t. It’s an information game the propagates out from the OTC market and the all the risk reshuffling that gets farmed out in chunks to institutional vol desks. At some level it gets “into” the listed market but the scent has to be picked up higher in the chain of issuance to understand the arrows, dependencies, and inflections.]


Exploring the 1 sd collar spell

The next spell is the 1 sd collar (also known as a risk reversal or god help you if you trade commodities, “a fence”)

Long 1-s.d OTM.put

1-s.d. OTM call

Notice how this is put “minus” call. that means if the collar trades for a positive value then the put price > call price.

Again we will divide the package price by the spot price to normalize and we are still using 90 day maturity.

Let’s use USO, the oil etf. Instead of pointing out what’s interesting in each of the charts I will cherry-pick questions so you can practice.

USO:

Chart 1

🌙What does it mean that the collar price sometimes goes negative? Do you think you can spot the Ukraine invasion in the chart?

Chart 2

🌙 The collar price can get extreme in favor of the put OR the call at high volatility. Why might that make sense for oil?

Chart 3

🌙The chart starts in January 2021. The puts started the year high relative to the calls declined over the course of the year then flipped in 2022. What’s the story behind the change?

Chart 4

🌙Compared to the SPY chart’s x-axis earlier what do you notice about oil’s weekly returns?


The decomposition of the collar into the separate call and put legs will let you see the drivers.

In early 2022, you can see the put leg was relatively stable after peaking at the end of 2021 but the collapse in collar pricing was driven by the calls exploding higher.

🌙Can you see the Oct 7, 2023 Hamas attacks in the chart?

SPY collars

I’ll just point out the animal spirits in the stock market. SPY collars are relatively cheap these days.

The contribution of the legs to the cheapness looks balanced. Puts are a bit low and calls are a bit high.

BITO collars

BITO is an etf that tracks BTC futures. It’s performance is marred for the same reason VXX stinks. Negative roll returns as the prompt future must be rolled into a premium 2nd month in a contango (upward-sloping) futures market.

You can see the effect clearly in the BITO cumulative return chart but it’s still useful to see the point to point changes. Even though the cumulative return since its inception is -35% you can see that in the past 2 months its surged from -60% to -35% mirroring BTC giant rally.

Interestingly, it looks like when they were first listed, the calls were premium to the puts (negative collar prices) before establishing the familiar regime we see in many assets — the puts are premium.

[More story time: In the mid-aughts during the commodity “supercycle” there was a lot of noise about commodities as an asset class, financialization, yada yada. I was on the NYMEX floor when WTI first breached $100. IIRC a trader overpaid for a one-lot in the pit lot to own the memorialized print.

Anyway, call skew in the oil markets got annihilated with financialization. Why? Because to passive investors, calls are free money to be sold. So as something becomes financialized you have some prior about what will happen to the call skew. Something to consider for all those bulled up on IBIT calls these days. I’m not exactly sure what happened in BITO when it got listed, but maybe the first option quoter was still wearing footie pajamas back when commodities became an asset class.

As you can see from the USO charts, the skew in oil is fascinating because barrel prices can crash down like during COVID or up. From a long history of trading oil, owning the call skew has been positive expectancy because hedgers are a steady supply of upside-vol yet the true distribution includes crash-up potential.

This was also true in heating oil and gasoline. Gasoline is a smaller market than crude oil and less liquid. My approach to OTM calls in RBOB — buy em’ when they’re cheap, only sell them closing. Never open on the short side “because they screen high.” Same attitude in nat gas or anything that gets real sloppy on the upside as liquidity evaporates. There’s probably edge in being short because that’s where you’d expect the risk premia to live but the risk/reward and survival imperatives mean only those messing with other people’s money get wide-eyed at that stuff. I guess you could always trade it small but also maybe find other ways to deal with your boredom.]

Spellbooks

I’m not going to show charts for each asset but just summarize just show this self-explanatory spellbook.

You could imagine columns for decomposing the legs and their stats. On and on. You could see how one might want 10 screens.

[We don’t have this in moontower.ai but we’re excited about all the wood we’re gonna chop in 2025 😉]

Actually on the 10 screens bit — a normal human thinks that sounds like a nightmarish work environment. But you have to have some faith that this works just like walking and chewing gum. You get used to it. Plus all the dashboards are the survivors of the evolutionary screen-space tournament. What’s left is a bunch of tables and charts that your eyes easily scan and process into a gestalt. It’s like the market is having conversations all around you but a well-constructed cockpit will simulate the cocktail party effect — you’ll identify the most prominent features of what market parameters are changing today. This is the “science” part. The actions are the art.

Wrapping up

Some repetition and a smattering of observations that might not be obvious to learners

  • Using 90 day options means we need to multiply the typical cost of these structures by 4 to annualize
  • Assets vary in what a “typical” vol surface looks like. SPY always has a pronounced put skew. Coffee and VIX have inverted skews. Gold is usually a true smile with both far OTM puts and calls trading at premium vols to ATM. The same spell therefore varies in cost across markets.
  • Decomposing spells will let you see what legs are driving the cheapness or expensiveness of the package.
  • In keeping with the “options as a language” metaphor, volatility metrics like “implied vol” and “skew” can be seen as a abbreviations. Like if the put skew is high, the price of the collar will be high. But when you trade you don’t trade “skew” or “vol” directly but you trade contracts with actual prices. The vol metrics are handy ways to normalize in the same way that P/E is an attempt to normalize for comparison. But you trade actual instruments not metrics. As an option user, you open an option chain but its gibberish. Vol surfaces and metrics help you make sense of “all the numbers” on the screen with curves and historical context. We use the metrics to zero-in on what we want to do, but for execution we shift gears back into prices and strikes not vols and deltas. These spells are like a transformer layer between vol lens thinking and price thinking.
  • You have an opinion about the market, but is your opinion bid or offered? The options market can tell you. Remember stock and asset prices in general are low resolution. Options are surgical. Just like parlays, the relative prices between the propositions imply tradeable ideas. Options are the coding language in which ideas are scripted into trades.

insights from a moontower.ai user

I had a long chat with a user who’s been trading as a primary means of income for over a decade. I was deeply impressed to watch how this individual followed the recipe we lay out in The Moontower Mission Plan while incorporating their own spice.

How they combine “volatility lens” with “directional bias”

  1. Uses the Dashboard to find a name and term where the volatility stands out as cheap or expensive
  2. Then checks if the stock is near an extreme (using technical indicators they’ve tuned over time)
    1. Employs contrarian/reversion delta bias + volatility bias to spark a trade (e.g., if at the low end of range and volatility is cheap, buy volatility with bullish bias—i.e., calls, depending on where skew might prescribe, or sell puts if volatility is high).
    2. If the stock is in “no man’s land,” then does nothing.


Notes on the user’s activity and some feedback I offered:

  • Primary tool is DASHBOARD.
  • There’s a trade to do every few days, but the practice of stepping through the progression daily every morning has built up a memory. This primes action when the situation sets up.
  • Sometimes looking for the cheapest source of beta — inexpensive ETF options or cheap options in single stocks that have a large weight in an index.
    • Gave a recent example of this. User bought options that looked cheap to get long. The directional bias worked and it was a profitable trade BUT volatility got smashed so won less on the calls than expected (another way to frame that is the option behaved on a smaller delta than you expected)
    • As volatility fell even further from low levels, I explained how it’s possible to monetize the delta (ie directional) victory while taking advantage of the even more attractive volatility by buying puts or rolling—selling the calls and, if still bullish, buying 2 OTM calls. You can be more creative but these are just a few ideas. You can use a combination of your directional bias and surface metrics like skew to pick strikes

Finally, an important point that is a bit harder to internalize outside of professional trading contexts.

Just because a vol looked cheap earlier and got cheaper doesn’t mean it’s still cheap!

Why?

Because it depends on what the rest of the “blob” did.

If the rest of the universe saw vols dive even faster you might actually think the vol you own is now expensive.

This is why you don’t think about the history of trades. It’s no longer relevant that it used to be cheap. Now it might be expensive. There should be zero notion of “taking profits” or “locking in a loss”.

It’s always day zero (to use a Bezos-ism out of context. )


Euan and Andrew have an adjacent riff about this in Retail Option Trading. Note how p/l is not a factor in deciding to trade!

The thinking below is exactly how I thought about my trading portfolio and how I think today about my personal portfolio.

Actually, this way of thinking is so ingrained it’s one of those “curse of knowledge” things where I don’t realize that beginners don’t see this as obvious. (And it’s not obvious — you learn it which is what this is all about).

Stop thinking in terms of shares or options. Think in terms of risk exposures. Don’t anchor yourself to the fact that you own 1,000 shares. Instead, think of it as having 10% of your portfolio in that stock.

Always have a target portfolio allocation. For example, based on some analysis, you decide you want to have 10% of your $1,000 portfolio in Stock A. Now the stock doubles and the allocation goes to $200/$1,100 or 18.2%. This doesn’t match what you want, so sell $90 worth to get the allocation back to $110/$1,100 or 10%.

Don’t get hung up on terms like “taking profits,” “letting profits run,” or “looking for an exit.” You don’t have the position you want, so do what it takes to get to the position you want!

People often struggle with this concept, but it doesn’t matter whether we’re talking about shares, vega, theta, or any other risk factor. The answer is always the same:

  1. Have a desired position.
  2. Compare what you have to what you want.
  3. Change what you have.

It’s honestly that simple.

Kind of…

In reality, adjusting your position incurs costs. You need to let your portfolio move around your target allocation by a bit. Exactly how much variance you allow is a balancing act:

  • High costs? Allow more imprecision in your portfolio weight.
  • Low costs? Allow less variance.
  • Higher tolerance for being unbalanced? Trade less often.

The Most Underappreciated Aspect of Trading

A little experiment — talking into a camera instead of writing.

The topic… “the most underappreciated aspect of trading”


A rough script

The Most Underappreciated Aspect of Trading

In the world of trading and investing, there’s a lot of talk about modeling and methods and all kinds of geekery. This is all well and good. If you read Moontower, you’ll see plenty of that stuff. But I want to talk about the most underappreciated aspect of trading today.

Before we get to that, think about what it must be like to make a market in newly listed options. It’s a relevant question today since it’s listing day for IBIT options. IBIT is the spot BTC ETF. If you’re opening the market for IBIT options, you have both Deribit and BITO options to help you triangulate a decent opening line.

If you were the first person to make a market in Pepsi options, you could look at KO vols as a starting point on how to model them. Just like a bookie who sets a line, you’d start with a good guess and then iterate based on flows. The key is you start with some model and adjust. Just like Newton’s method or any procedure that iteratively solves for the roots of a math function, the first guess isn’t that important and doesn’t even have a large impact on how long it takes to get to the “right answer.”

You just need something. A starting guess. A starting model. The iterative process matters more than the model, which you know is wrong anyway.

Let’s hold that thought.

A Bit of Crafty Wisdom

I’ll share a bit of crafty wisdom that market makers understand:

When you look at a price, you wish you could have traded it as counterparty to the aggressing order.

A simple demo: A quote is $1 bid, offered at $1.20 and it trades $1.15, and I ask you to pick what you’d want to do at $1.15.

You say “sell”. This isn’t a trick scenario. That’s the right instinct on average

Again, when you look at a price, you wish you could have traded it as counterparty to the aggressing order.

Now for the anti-climax.

It’s a fake idea because had you been on the price, the price would have been different. You would have affected it. This idea is like a painting to be viewed from afar. It’s not of any practical value, um, other than the fact that it holds the deepest insight in all of trading.

I don’t say this lightly. I can’t prove it. There’s a lot of nuance around it. But it comes from something deeply felt from spending the first half of my institutionalized career as an options market maker and the second half as a buyside options PM. I’ve traded tens of millions of option contracts. Far less than half electronically, too.

The Most Important Question

The first thing you should classify when looking at a price: is this thing bid or offered?

Do they love it, or do they hate it?

I’m hesitant to generalize to other forms of trading, but vol trading is a fundamentally contrarian endeavor. You hold your nose when you trade. If you like your trade, you should be nervous.

You’re uncomfortable? Get used to it. Bruh, that’s the job. To fade everyone else’s greed and fear.

Analysis vs. Price

I said I can’t prove it, and taking even a pro’s word for something is hard. I’m with you. Skepticism is a good reflex, especially in finance. But I’ll take a stab at making my point more concrete.

I saw a tweet this morning from a mutual who I respect. It was about how he liked selling puts on names that have plenty of cash, flooring the value of the stock much higher than 0. Let’s accept this, and we’ll call it analysis.

“I did analysis, and this stock is worth, by sum of concrete parts, at least $10, whatever.”

In a poker context, he’s playing the cards. He’s done the work. He’s done the math. The motivation to trade is resting on analysis. On the cards.

However…the outcome of the trade depends on the interaction between the price and future states of the world, both seen and unseen. You must think of any trade as an instance of a decision process that you are repeating over the course of time, albeit with different details each time.

The analysis in this case was focused on states of the world, which is great. It’s part of what drives the outcome of the trade. But let’s zoom in on the idea of price, since it’s as critical to the trade as the health of your Siamese twin. The outcome is no less about the price than the analysis.


Critical Price Considerations

I don’t need to use a concrete price. We just need to consider: is this option—this put option—bid or offered? Forget the option surface, forget the dollar price, forget any quantitative analysis.

Does the world look at this option and think, “this thing deserves to be sold”?

You need some theory of mind here.

When you imagine how other people look at this option, what do you think they think? How hard was it to see how much cash the company has?

Let’s say that you have reasoned that, in fact, no reasonable person would care to buy this option.

So, what do we know about the price?

Well, if there’s any volume, we know it’s trading. And if everyone who does analysis comes to the sanest conclusion that this option should be sold, then the price has a crowd on the offer, and the buyer is a market maker who either:

  1. Thinks the price is cheap against something else in the market they can sell against it.
  2. Thinks there’s enough discount baked into the price that it’s worth owning.

The Mechanism of How Crowded Sentiment Gets Disappointed By The price

It’s so often the case in options that extreme one-way sentiment sows the seeds of the counter.

The market buys so many call options that it causes a gamma squeeze. BUT if the options were so expensive that the gamma was actually quite small despite the number of options bought, then as the stock goes up to the immediate delight of the longs, it disappoints.

See, the longs were all motivated by a quick strike, not long-term holding. So, the once-call buyer is a future stock seller. If the stock doesn’t go up quickly and far enough, the call holder starts wondering if they are a bag holder on a rapidly decaying option contract.

A build-up of open interest on one side of an option contract can be thought of as an order book distributed across time. There’s stock to buy or sell in the future—it’s just which side of the open interest will need to do it and what are the properties of that cohort when averaging their behavior.

(If you don’t trade options, you may have heard a similar framing in pure stock trading: every short is eventually a bid for the stock, but this is not as strongly true for longs.)


If You Only Have Room For 1 Takeaway

For a trade to be successful in expectation, it must be attractive NET of the fact that it is bid or offered.

This means you can make guesses about the good side of a trade without doing any analysis. Ask yourself, “What would everyone want to do with this contract or instrument?” and recognize that the price that is actually trading is sufficiently profitable to find a counterparty who is willing to tolerate loneliness and ridicule.

Always ask yourself, “At this price, what is the market begging for?”

The inner monologue as I would trade against someone was always:

“Eh, you’re probably right, and holding this is gonna suck for me, but the price you’re paying is gonna disappoint you.”

You are welcome and invited to do all the analysis you want, as if investing were a problem set. But remember: the exams are graded on a curve.

Did you beat the spread NET of it being bid or offered?


Practical Tips

General tip:

  • If you do finance, then study finance. Balance sheets, accounting, and so on.
  • If you’re in trading, study gambling and actually do trades.
  • If you’re in investing, you need to do it all.

    (Topic for another time, but that last fact is why you would expect the number of exceptional investors to be far smaller than what the investing world would have you believe. Said otherwise: the number of good investors is smaller than the number of good track records.)