
Friends,
Imagine. You’re a zygote hanging out in the fancy airport lounge of the cosmic ether. Chatting with other unborns while sipping a mimosa and charging your phone. Meanwhile on Earth, a couple bails early from a holiday party and Lyfts it home. The couple will soon be asleep but not before the ancient power of wine and nature take its course.
The loudspeaker in the cosmic airport lounge summons you. Next thing you know, you’re en route to sit in a uterine waiting room until Labor day.
Who Will I Be Born To?
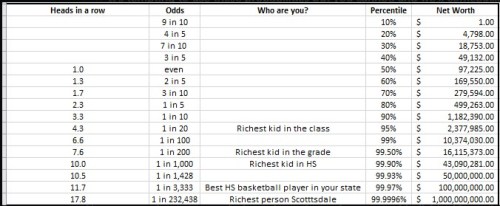
Let’s say you start flipping a coin on the flight. How many heads in a row you flip determines whose house you go to. No heads at all? Ouch. Your soon-to-be-mother is struggling to keep a job while her baby daddy stands before a judge for domestic violence.
Flip a single head and you arrive at the median net worth household. You got two parents and statistically speaking .5 siblings.
Flip 3 in a row and you’ll get some overachieving parents who are going to spend the next 5 years wondering if they should ‘redshirt’ in kindergarten since your birthday is right on the cut-off and if your the oldest kid in the class you’ll be better at sports and blah, blah, blah, blah…You’ll probably be in the safest car seat and your parents the life of the party I’m sure.
Now, what about 11 heads in a row? Jackpot. You are being dropped into a Calabasas mansion to an ambitious family that knows how to wring clicks from the genetic advantages securely stored in your carry-on. In an era where anyone can get Warhol’s “15 minutes” but not a minute more, this family knows how to get their 15 years (and counting).
This table approximates the household a zygote headed for America can fall into. (I cobbled it together from 2016 DQYDJ data).
Enter Kylie Jenner
After selling a stake in her cosmetics brand she is now worth $1.2 billion. Here’s context:
First off, let’s just get one indisputable fact out of the way: Team Kylie Jenner has built a remarkable business. It posted revenues of $200m last year, and is on track for Ebitda margins of 25 per cent this, all while growing 40 per cent. For reference that’s more Ebitda than Uber, Lyft and Peloton made in the last quarter. Combined. (Link)
Then this guy:

The internet has been arguing over whether she is “self-made”. Just check out the comments.
People can’t wait to discount the success of people who “start on third base”. People like to drink Haterade. That’s old news. But it does bring up an interesting question. How likely or unlikely was such an outcome based on where she came from? After all, her half-brother Rob shared many of the same advantages.
What would be the equivalent level of success for somebody who started in a regular household? Well, let’s see. We can use the table to see how many heads in a row it would take Kylie to become a billionaire from her roots. Her silver spoon roots place her somewhere between decamillionaire and centimillionaire. From there, it’s about 7 heads in a row to billionaire. Translating that to a person born into the median net worth home, that’s the equivalent of Mary Smith rising to become the richest person at their HS if not their whole school. A 99.9 percenter.
Using that logic, you can still see just how unlikely it was to pull off what she did. You can lessen it since it wasn’t impossible from the get-go but there’s lots of things that impress us even if they aren’t impossible. Throw in the fact that regression to the mean shows most rich kids remain outshined by their illustrious parents. Meanwhile, Kylie blew them out of the water (financially speaking).
Dissonance
You’re skeptical. “Wait a minute, Kris, you can’t use the raw odds of being born into a certain household to estimate the probability of moving higher through the ranks? When Kylie gets her last name she also gets a weighted coin.”
Congratulations. You have just discovered a major flaw in the income equality conversation dominating the nation. In this week’s Money Angle we’ll see why.
The Money Angle
Blind luck matches your unborn spirit to a physical baby body on Earth. The spirit didn’t audition for the part. Where you arrive? To whom? In what century? Blind, dumb luck. But the second the baby opens her eyes her conditions and her genes interact. A unique trajectory unfolds.
Repeat this process billions of times across geography and history. Interject randomness, a magical insight or a stray bullet. Watch as outcomes diverge just as a narrow river flows down a hill, widens at the mouth, then spreads into a vast ocean.
The combinations are infinite and we can’t help but wonder what variables along the way cause which outcomes. Consider the life of an attractive woman. I’m ready to non-ironically play the violin for exceptionally pretty girls. Why? Because I can’t imagine how they must navigate all the distorting signals they receive, an excessive quota of creepers they’re going to attract (in addition to desirable mates), the baggage they might have incurred in the process, and the feedback loops that sweep them up. It’s easy to see how arrows of causality rarely point in one direction. Every blessing rides with its own curse.
How does this relate to income inequality?
In order to study how people arrive at different outcomes you must follow the same people around and only then do you have a chance to disentangle the interaction of their qualities from their conditions. You must track the water as it travels from peak to basin. If you just sample the water in the starting and ending locations you have no chance of uncovering whys and hows.
The discourse on income inequality makes exactly this mistake. Everyone is familiar with a graph that looks something like this:

If you Google image search “income inequality” you will be bombarded with charts like this showing that the rich’s share of income has increased relative to the poor and median. While it’s true that the bucket of people considered “rich” now earn even more than the bucket called “poor” over time, these studies are all based on snapshots. And they make great kindling for outrage, attention, and political thrust. They sell like steroids at the Jersey Shore.
But it also masks the good news. Regrettably, good news doesn’t have a natural buyer.
Like the Kylie Jenner problem, that chart tells us absolutely nothing about one’s chance of climbing or falling through the ranks. That is the question we really care about. Russ Roberts writes:
What the snapshots show is that the rich today are richer than the rich of yesterday. If rich people are the same people as yesterday, then one’s class determines one’s fate. But if they are not the same people, the snapshots tell you that the dispersion of income has increased. That may or may not bother you, but it doesn’t necessarily mean that there is a distinct group called “the rich” who are capturing all the gains while the rest of us tread water.
A Much Rosier View
In his outstanding essay (link), which I’d go far as to call a PSA, Roberts shows the most dramatic claims by the pessimists that no one is making progress other than the rich are wrong.
1) Distortions in the snapshot methods conspire to make inequality look much worse than it really is.
You can’t use two snapshots to conclude that only the rich have made progress. It’s possible that everyone from the earlier snapshot has actually gotten richer and then been replaced by different people whose incomes will also rise. The people in the snapshots are not the same people.
Immigration, divorce, and marriage rates all distort measure of progress. Roberts creates this easy-to-follow video showing how snapshot math can make it appear that the poor are doing worse even when everyone’s income doubles!
In this diagram captured from the video he creates a hypothetical to demonstrate how divorce rates impact snapshots.

Imagine 5 quintiles with 2 families in each bucket. Every person earns the same amount. 30 years later we take another snapshot and every individual’s income doubles but half the families divorce resulting in 5 more households. Now when you look at the quintiles it appears the top 2 quintiles benefitted at the expense of everyone else, yet in this example, every person in society is benefitting equally from the stronger economy.
Immigration and marriage rates will reveal similar effects.
2) Longitudinal studies > snapshot studies
Roberts emphasizes the biggest problem with the pessimistic studies is that they rarely follow the same people to see how they do over time.
The data crunchers at DQYDJ, a leading site for income studies, make similar warning when viewing data that is not longitudinal:
You can not draw any conclusions about the performance of individual households from this data. Households in certain income brackets move up or down the income spectrum, but the data as presented doesn’t give any history or hint of movement. The only fair way to draw conclusions about the performance of last year’s households is with repeat surveys given to the same subjects.
3) The American dream is alive and well
Roberts reveals encouraging conclusions when you look at the results of longitudinal studies. Many are summarized in this video.
The pessimistic story based on comparing snapshots of the economy at two different points in time misses the underlying dynamism of the American economy… When you follow the same people over time, the largest gains over time often go to the poorest workers; the richest workers often make no progress.
4) What it actually looks like when “the ladder has been pulled up”
Nassim Taleb observes social mobility in the US vs Europe:
Static inequality is a snapshot view of inequality; it does not reflect what will happen to you in the course of your life
Consider that about ten percent of Americans will spend at least a year in the top one percent and more than half of all Americans will spend a year in the top ten percent. This is visibly not the same for the more static –but nominally more equal –Europe. For instance, only ten percent of the wealthiest five hundred American people or dynasties were so thirty years ago; more than sixty percent of those on the French list were heirs and a third of the richest Europeans were the richest centuries ago. In Florence, it was just revealed that things are really even worse: the same handful of families have kept the wealth for five centuries.
You do not create dynamic equality just by raising the level of those at the bottom, but rather by making the rich rotate –or by forcing people to incur the possibility of creating an opening.
The way to make society more equal is by forcing (through skin in the game) the rich to be subjected to the risk of exiting from the one percent
Or, more mathematically
Dynamic equality assumes Markov chains with no absorbing states
Our condition here is stronger than mere income mobility. Mobility means that someone can become rich. The no absorbing barrier condition means that someone who is rich should never be certain to stay rich.
Pulling from a NYTimes op-ed, this tweet maintains that economic rotation remains alive and well in the US.

Final Takeaway
As you get bombarded this election season with discussion of income inequality, remember, the snapshot view you are being fed is:
a) politically useful
and
b) doesn’t answer the question you care about: what are the prospects for me and my loved ones?
That the rich today are richer than the rich of yesterday is a very different finding than that the rich are getting all the gains. Too many economists have treated these as identical. The snapshot approach does not capture the impact of economic growth on people’s material well-being or provide evidence that the rich or the poor are static categories no one ever escapes. [While none] of these studies is decisive, [what they] show is that the economic growth of the last 30–40 years has been shared much more widely than is generally found in the cross-section studies that compare snapshots at two different times, following quintiles rather than people.
Extra credit question I have for the finance-minded
Are low real interest rates actually progressive by flattening the compounding effect of wealth. Asked differently: do low rates of return in markets make being rich less of an absorbing barrier?
Climb Higher
The way to do a study like that would probably be a Bayesian experimental design. For example, you’d take the base rates from the broader longitudinal studies and adjust them for the specific reference class you are studying. A statement that sounds like “how did children born in the 1980s do given they had access to a PC or given they grew up in Beverly Hills?” The conditions after the word “given” comprise the reference class.
In Kylie’s case, what was the right reference class? What’s the relevant condition? Being a decamillionaire to start? What about her IG followers? Not all decamillionaires enjoyed her fame. What about the fact that she became a billionaire so quickly?
The critical observation: experimental design has an enormous impact on the results of studies that show up in our feeds that then spread like truth at happy hour. A poorly constructed design or reference class has downstream effects that can swamp the conclusions.
A recurring Moontower theme is the world is messy, be critical of tidy takes. Alas, don’t despair, here are some guides and concepts to keep in mind.
Making Better Comparisons
We learned how easy it can be to overreach for conclusions from snapshot data. Russ Roberts pointed out the danger of averaging averages — Simpson’s Paradox. It states that the change in the average is not the same as the average of the changes. When I interviewed at Susquehanna coming out of college, one of the questions was a perfect example of the paradox, even if I didn’t know the term for it back then.
The question: If batter A has a better batting average than batter B for the first half of the season AND batter A has a better batting average for the second half of the season, is it possible for batter B to have a better batting average for the whole season?
The answer.
Life expectancy example
In 1900, life expectancy was about 47 for a US male. Does that mean you were middle-aged by the time you left college? Of course not. If you made it to 22 years old there was a good chance you’d live well into your 60s or older. Life expectancy is extremely sensitive to infant mortality rates. In 1900, infant mortality was around 20%. Today it’s closer to .5%.
Society 1:
Infant mortality = 30%
Survivors who make it past infancy live to 80
Life expectancy = .20 x 0 + .80 x 80 = 64 years old
Society 2:
Infant Mortality = .5%
Survivors who makes it past infancy live to 80
Life expectancy = .005 x 0 + .995 x 80 = 79.6 years old
Without tracking the lives of people, the snapshot of life expectancy can make people jump to all types of silly conclusions about the 2 periods. When we study longitudinally we would have seen that someone who makes it to 32 is still far from middle-aged.
Last Call
- Remember that plan where you and your college friends agree to buy homes all on the same block where your children can roam freely between each others’ homes? Yinh found a group that actually did it. (Link)
- I’ve written a bit about homeschooling before. Robert sent me a provocative post about “un”-schooling. (Link)
- Holiday weeks can be slow at work. Here’s one of my favorite talks ever. The real-life Frank Abagnale, portrayed in Catch Me If You Can, is a cybersecurity expert at the FBI. He has practical tips and an extraordinary life story. (Link)
- The Morning Brew daily letter is actually very good. Content scratches the right itch and the tone is fun and smart. Here’s the referral link.
- Home renovations will overwhelm you with decisions. Avi and Ivy borrowed a system from a friend to minimize the inevitable marital tension that renos seem to inspire. It’s called 5-2-1. Avi sources 5 paint colors, Ivy narrows to 2, Avi settles it. Marriage preserved.
From my actual life
This letter started with a discussion of cosmic luck. There are 7 billion people in the world. You have about a 1 in 6 chance of being born into the “developed” world. My gratitude starts there.
I didn’t quite catch the heads required to end up in the crib of a median American family but I got something more valuable. Parents who love me and cared about my future.
They met here in the US but they are both from Cairo and they were not in the US long before meeting one another and having me in 1978. As all immigrants must, they navigated a strange land and a strange language. One of my favorite bits of family lore is how weird they thought the spaghetti sauce was in the US. They thought Americans’ taste buds were broken. Turned out my grandpa was buying ketchup.
In my spoiled existence today it’s hard to imagine what they went through and with so little. And yet despite the odds, I was given great opportunities and have had amazing luck:
- I’m 6’1
- My parents are hard-working and my mom was especially demanding. She worked in treasury ops at banks when I was growing up. I was sorting fixed income traders’ mail when I was 16 thanks to her. I commuted from Hazlet, NJ to Manhattan at 5am in my summers to work. I got paid $16/hr in the 90s.
- I have thus far dodged serious illness. I survived 2 serious car crashes before age 21 (at age 13 I had the experience of seeing and touching my right shinbone before I had even realized what happened). My apartment building burned down my junior year of college (thankfully everyone easily got out well before any chance of injury). Everyone has crazy experiences. That you are still around to have them has nothing to do with merit. Blind luck.
Speaking of college one of the most influential moments in my life was my choice to go to Cornell. My mother had always pushed me and spoke of this place Cornell before I was even in HS. When I visited the campus, I immediately loved it and applied early decision to maximize my chance of getting in. When I did get in, she and I were over the moon. But in a moment of major doubt and looking at the cost, I hesitated. You see Rutgers would have been a full academic scholarship. Cornell was gonna cost close to 30k per year. I didn’t want to saddle my mother with any more burden. She had already shouldered the bills of a private Catholic all-boys HS (CBA in Lincroft). And when she couldn’t afford it, she begged the school to let me attend without paying. She never gave up and it worked. They graciously made an exception for part of my tuition.
She had a one-tracked mind. Give her son a chance.
In the end, she convinced me with a plan I could bear. Cornell offered 1/3 of the cost in a need-based grant that she wrote many letters for every year. She and I would split the remaining cost equally. I’d pay my share with loans and my summer job earnings. She believed Cornell was going to mean more opportunities.
She had a one-tracked mind. Give her son a chance.
If you simulate my life 100x over I probably don’t end up with the professional luck I’ve actually enjoyed in 90-95 of those sims. I punched above my intrinsic gifts. But I have respectable outcomes in most of those sims because of who my mom is. Sure I had to meet her part of the way with effort but ultimately she gave me the best chance.
I’m thankful for being born in America and that my family fought their way to get here. I’m fortunate to grow up in a home that taught me how to fish even though it didn’t have much fish to give me. I’m not very interested in politics but if I had to say, I’m a lot more liberal than my parents. But something I would agree with them on…when I watch politicians fan the flames against the rich on what I feel are extremely exaggerated claims about what income inequality really is I recoil.
The prosperity of the United States and the possibility to push yourself or your kids into a better life has been calling to foreigners for over a hundred years. Anecdotes are not data. But having seen enough people from humble roots succeed beyond their expectations, makes me thankful I live where those anecdotes are not outliers. Billionaires are outliers. Kids from Hazlet or Newman, CA (Yinh’s hometown) who end up in our shoes are very much part of the real distribution.
If there is a devil he wants you to compare yourself to your neighbor. It’s that simple. It’s his most effective trick. And it’s subtle. Don’t pay attention to his whispers.
This Thanksgiving I’m grateful for all the luck it took for me to be able to sit in a warm house, with wifi and the time to write this. To have my children fed and asleep in bed (they’re in my bed tonite the rascals) and for my wife to be peacefully passed out while watching TV. There’s a lot of heads that had to come up to be here but it all started with a chance to play.
Enjoy your loved ones this Thanksgiving and much love from me. As always, thanks for reading.