
Friends,
Left brain issue today, but stick with me. Let’s start with a puzzle.
“You have 100kg of potatoes, which are 99% water by weight. You let them dehydrate until they’re 98% water. How much do they weigh now?”
[Jeopardy music]
.
.
[Keep trying…]
.
.
[Here’s a hint if you’re stuck]
Here’s the answer.
Congrats, you just solved what is known as the Martian Potato Paradox. I came across it on Twitter and I re-tweeted it to explain why I think the problem’s general lesson is important.
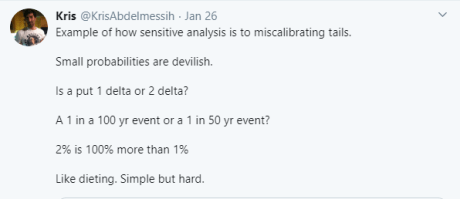
Small Probabilities Are Devilish
The potato problem is tricky is because small percents are tricky. The jump between 1% and 2% feels insignificant. I suspect that is an artifact of our additive thinking. But once we point out that the 2% is 100% larger than 1% we get closer to the correct intuition. We can see that a jump from 1% to 2% is more significant than the jump from say 50% to 60%. The solution to the potato problem holds the key…you need to look at the significance in the payoff space not the probability space.
Let’s consider a bet. In 2014, the betting odds of Donald Trump being elected was say 1%. 1% corresponds to 99-1 odds. If his probability increased from 1% to 2% the new odds are 49-1. A person who was long Trump just doubled their equity in the position. 1 to 2 feels small. But 99 to 49, similar to the potato problem, shows how significant that extra 1% truly is. (I have a friend, a world-class gambler actually, who lost $400k betting against Trump before he was even a nominee. Highlights how dangerous it is to be wrong about the tails of a distribution.)
Meanwhile, a bet that has 33% chance, has fair odds of 2-1. A bet with a 25% chance has fair odds of 3-1. While these are large differences in odds, being wrong about them is less likely to be catastrophic. Beware the small probabilities.
I made this chart as a visual reminder that being miscalibrated by just 1% leads to massive error in payoff space when dealing with probabilities or payoffs below 10%. Again the difference between 1% and 2% is a 100% error in payoff space while the difference between 50% and 51% is a mere 2% error in payoff space.

I Don’t Gamble. Why Should I Care?
If you are a taxpayer, commuter, ever been a patient, or live near natural disasters you are gambling. Whether you want to be an ostrich about that is up to you, but modern society is constantly forced to handicap small probabilities. And miscalibration can have catastrophic payoffs. Let’s move to examples.
Natural Disasters
I’ve covered basic earthquake math before. If the odds of “the big one” in any given year is 1% it’s a 1 in 100-year event. If it’s a 3% event, it’s a 1 in 33-year event. That seemingly small delta is the difference between ignoring the risk and being prepared for one in your homeownership years.
My commute is a good demonstration of how the government’s assessment of risk affects all of us. Last year, SF undertook a multi-year retrofit of the Transbay Tube to withstand a once in 1000 years earthquake. They believe it can currently withstand a 1 in 100 years event. As you can imagine this is an expensive use of public funds predicated on their ability to estimate small probabilities. The direct costs are obvious. A dollar for this project is a taxpayer dollar. Which means it’s also a police force, firefighter, or teacher opportunity cost dollar. Never mind the opaque costs. The retrofit required them to start the trains later every day. I know because I used to take the first train which is now 30 minutes later. This forced many people whose work hours are extremely rigid to now drive to work. BART claims this later start will save 4 months of construction time and $15mm+ in costs. Well, how many lives can be lost to car accidents before that measly $15mm is offset? That leads us right to our next topic…
Tort Damages
Remember Ed Norton’s job in Fight Club? He would compute the expected value of lives lost vs the cost of recalling a faulty vehicle. While this sounds callous, this calculation, known as the “value of a statistical life” or VSL, is not the strict domain of evil corporate calculus. It’s the basis of medical damages, workers comp, and various forms of insurance. If you look online you can find ranges of these values based on various countries’ legislation but on average you are talking about a 7-figure sum ascribed to human life.
There’s a rich economic and legal literature dealing with these calculations. We can make inferences by what people pay for insurance or how much they say they be willing to pay to reduce their risk of injury. No method is perfect but pragmatism is such that human life is very much not “priceless”. When I was in college I wrote a paper for an Econ and Law course that tackled this problem by way of revealed preferences. Let’s pretend 2 occupations were the same qualitatively but differed solely in their risk. The riskier job would pay more. The difference in pay can be used to imply how people put a price on their life.
After a quick search, I found that a cab driver’s chance of death on the job was about 2 in 10,000. A logger’s occupational fatality rate is 5x higher, but still just 10 in 10,000 or 1/10th of a percent. Making up numbers now, if a logger makes $70k per year and the cab driver $60k, then we can imply a value of $12.5mm for the value of human life based on this revealed preference method.

Put your distaste for this approach away for a moment and note how sensitive the value of human life is for seemingly small changes in “perceived death risk”. If the logger thought his actual death risk was 1% instead of .10% and he only accepted a $10k per year premium he’s valuing his life 12x cheaper. Even though we are talking about a seemingly small change in probability, in percent terms we increased the risk by 10x and this is obvious when we see the result in payoff space. The logger is valuing his life at a mere $1mm.
The broader policy takeaway is that torts and damages are built up from small probabilities making them swing wildly or prone to large deviation based on optically small differences in risk assessments.
Health
Without math, we can see that the decision to do Lasik or eat blowfish is sensitive to very small probabilities. Lasik you would likely only do once in your life but the difference between a bad outcome being 1 in 10,000 or 1 in a 1,000 might matter if your livelihood depended heavily on your vision.
And for a repeated risk, and I’m sorry but taking a helicopter every day falls in this category, the math deserves a visit.

No doubt, accidents are exceedingly rare. In 2019, less than half the accidents were fatal which is even more comforting. Kobe’s fate was awful luck even considering how frequently he flew. And we can see how flying frequently certainly compounds the cumulative risk. But I want to point out that tripling the accident rate shows up proportionally in the “payoffs”, while in probability space it remains invisible. If I told you the accident rate was 1 per 100,000 flight hours or 3 per 100,000 flight hours you probably wouldn’t bat an eye.
The lesson:
You need to look at the payoffs of small probabilities to appreciate the differences.
The Money Angle
You would need to be living under a rock to not know about the importance of small probabilities on asset distributions. By 2020, every investor has been Talebed to death by his golden hammer. But knowing and understanding are not the same. I know it’s painful to give birth. But if I claimed more than that I’d end up only understanding what it felt like to be slapped in the face.
I’m hoping the above discussion of the devilish nature of small probabilities makes the seemingly academic topic of fat-tails more visceral. But if it didn’t I’m going to try to drive it home in the context of a real-life investing decision.
Step 1: Understand the impact of fat tails
I ran a simple monte carlo assuming the SPX has a 7% annual return (or “drift” if you prefer to sound annoying). I assume a 16% annual vol or standard deviation and ran a lognormal process since we care about geometric returns. We’ll call this model the “naive simulation”. It does not have fat tails.
Based on these parameters, if you invest on January 1st:
- You have a 5% chance of being down 23% at some point during the year.
- You have a 50% chance of being down 7% at some point during the year.
Now be careful. These are not peak-to-trough drawdowns. They are actually a subset of drawdown since they are measured only with respect to your Jan 1st allocation. The chance of experiencing peak-to-trough drawdown of those sizes is actually higher, but these are the chances of your account being X% in the red.
That’s the naive simulation. To estimate the odds in a fat-tailed distribution we can turn to the options market which implies negative skewness and excess kurtosis (ie fat tails). I used 1-year option prices on SPY. Option prices answer the question, “what are the chances of expiring at different prices?” not “what are the chance of returning X at any point in the next year?”. To estimate what we want we will need to use the pricing from strikes that correspond to the equivalent one-touch option. Walking through that is overkill for this purpose but hit me offline if you want to see how I kluged it.
Let’s cut to the market-implied odds.
- You have a 5% chance of being down 39% at some point during the year.
- You have a 50% chance of being down 11% during the year.
Now you can see the impact of fat-tails: the gap between 23% and 39%. This is the impact of kurtosis in the options. Meanwhile, in the heart of the distribution, the downside moves from 7% to 11%. Not as dramatic and attributable to market skew.
When we shift probabilities in the tails of distribution vs the meat the impact on the payoffs is significant.
Repeating this insight in a different way may help your understanding. Consider tossing a pair of dice. Imagine playing a game that pays the fair odds for a roll (i.e. craps).

Now let’s chip the dice to change the probability of how they land.
- In scenario 1, add 1% to the “7” and shave .5% from each tail.
- In scenario 2, add 1% to the “7” and shave .5% from the meat, the “6” and “8”

By shaving from the tails we take a fair game and turn it into a negative 30% expected value per toss. This is far worse than almost any casino game you might play. By changing the tail probabilities the effect on the game is magnified because the odds are multiplied across an inversely proportional payoff!
Step 2: How should tail sensitivity affect allocations?
By now, the danger of poorly estimating should be a bit more clear. How do we use this when making allocation decisions? After all, most of the time whether they are 1% or 2% events, huge moves are usually not in play. But we must care because when these events hit the impact is huge.
Tail outcomes should dictate constraints based on what you can tolerate. I’ll work through a conservative framework so you can see the impact of naive tail probabilities versus market-implied tail probabilities. The exact answers don’t matter but I’m hopefully offering a way to make tail-thinking relevant to your allocation decisions.
Reasoning through sizing decisions
Suppose things are going well and you are able to save $50,000 per year after paying expenses. You decide that losing $50,000 in the stock market is the largest loss you can accept, reasoning that it’s a year’s worth of savings and that you could make up the lost sum next year. If you impose a restraint like that, well, the most you can allocate to stocks is $50,000. That’s too conservative especially if you have accumulated several hundred thousand dollars in savings.
So you must relax your tolerance. You decide you are willing to accept a $50,000 loss 5% of the time or 1 in 20 years. Roughly a generation. If we use the naive model’s output that we lose 23% of our investment with 5% likelihood then the maximum we can allocate to stocks is $50,000/.23 = $217,000.
The naive model says we can allocate $217k to stocks and satisfy our tolerance of losing $50k with 5% probability. But if the market’s fat-tails are implied more accurately by the option skew, then our max allocation can only be $128k ($50,000/.39).
If we constrain our allocation by our sensitivity to extreme losses, the max allocation is extremely sensitive to tail probabilities. In this example, we simply varied the tail probability between a naive model using a mean and variance to a market-implied model which adjusted for skew and kurtosis. The recommended allocation based on our tolerance dropped a whopping 42% from $217k to $128k.
Many will point out that this approach is extremely conservative. Constraining your max loss tolerance to the amount of money you can save in a year seems timid. But the probabilities we used here did understate the risk. Again these were not peak-to-trough drawdown probabilities but the narrower chance of incurring losses on your start of year allocation. If we are thinking about the true experience of investing and how you actually feel it, you probably want to consider the higher drawdown probabilities which are out of scope for a piece like this. I know many financial advisors read this letter, I’m curious how allocation models reason through risk tolerance.
Current examples to consider in context of small probabilities
1) Bernie
There are market watchers who believe that electing Bernie Sanders would send us back to living in caves. Democrats are trading for about 40% to win the election. Bernie is trading at about 45% to win the nomination, implying an 18% chance to win the election. Market watchers who fear a Bernie presidency are either totally overstating his alleged market impact or the market is already discounting his odds. If the latter is true and the market is efficient, math dictates that it should shoot much higher in the event he loses.
At 18%, Bernie is no longer in the tail of the distribution. So you could argue that as he went from single-digit probability to his current chances, the market strongly re-calibrated either his impact or the sustained rally in the meantime would have been much larger. One of these things must have happened by the necessity of math as odds shifting from a few percents to 18%.
Or there is a third option. The market never really believed that Bernie’s impact would be as deep as his detractors contend.
2) Tesla
We have all seen this stock double in the past month. There has been a lot of talk about far out-of-the-money call options trading on the stock. These are bets on the upside tails of the stock over relatively short time frames. I won’t comment too much on that other than to point out a different tail in the matter. All the credit for this observation goes to a friend who keenly remembered that a year ago the Saudi’s collared their position in TSLA. That means they bought puts and financed by calls sold on the stock. Given the size of the move, the calls they sold are definitely deep in the money. This hedge likely cost them over 3 billion dollars. Billion with a “b”. That’s 6% of there projected government deficit. Their investment in TSLA stock was supposed to be a tail hedge against electric cars destroying demand for oil permanently. In the meantime, they got smoked hedging the hedge. The other tail in this story is going to be that of the official who recommended the hedge. This is a government that nearly executed a 13-year old for protesting. Fair warning to anyone looking to be an execution trader for the kingdom. You are probably short the mother of all puts. Make sure you are getting paid at least as much as a logger.
And one last TSLA note. This keen observation by Professor Bakshi.

Sometimes Keynes’ beauty contest doesn’t just judge beauty. It can create it.
Climb Higher
Gurwinder’s outstanding tweetstorm succinctly described 40 phenomena you can look for as you parse arguments and make sense of the world. My favorites were Nirvana Fallacy, the Matthew Effect, Simpson’s Paradox, and of course the Golden Hammer which I borrowed earlier. (Link to compiled thread).
Last Call
- David Laing on why good people need to talk more. A lesson he learned from playing Avalon. I have long felt that confidence is tyrannical. If a person acts confidently it can be overpowering even if it is in service of utter stupidity. In fact, this is why self-help is often so focused on it. It’s a life cheat code for better or worse. Remember Ben Affleck in Boiler Room. “Act as if”. If you don’t choose confidence I’m afraid you are choosing to “confess” in a Prisoner’s Dilemma of life. Laing’s approach is a more gentle reminder than my take, but his point remains. If you are a good person, we need you to speak up. (Link with my highlights).
- Separately, I discovered David’s blog this week and I’m a big fan. Turns out he’s a Moontower reader which flatters me. Check it out. (Link)
- Have you ever heard someone argue that privacy is unimportant? Or that only people who have something to hide demand it? That crap position is extremely narrow-minded. It is highly-privileged and fails to acknowledge the shifting nature of power. Paul Jarvis articulates it better than I ever could in his post But I Have Nothing to Hide. (Link)
- Hanabi is a cooperative game in which everyone except you can see your cards. You must communicate to construct an arrangement of cards based on tacit logic and limited info. 2-5 players. Takes 15 or 20 minutes. It’s pretty popular so you can find it at Target or Walmart and it’s a lot of fun. Feels like a social mind-reading sudoku. It also reminded me of the Two Generals Problem visually presented by Sketchplanations. (Link)
From my actual life
If you fell on the edge of the distribution this week by either:
a) really getting a lot out of it
or
b) think my explanation was hard to follow
just hit reply and let me know. If you elaborate that’s even better, but I appreciate any time you take to even read this stuff so if you want to just say “helpful” or “confusing” that’s cool. If you say nothing I’ll assume it was either review or you weren’t interested or it was just noise that blended in with all the other things you are bombarded with. It’s all good. I’m partly trying to tune and partly just seeing how I can get better at explaining.
Finally, I thought I’d share my response to a new reader who asked me about my “favorite books regarding the grander questions?”
As far as the metaphysical questions I don’t have a great answer. You can demerit me all you want for intellectual softness but I know I’m lacking in my reading of philosophy. So here’s my picks. Eye roll away.
The 5 Love Languages
- The lesson is that connecting with others starts with recognizing that people are so different, especially in how they communicate. But there’s a much broader lesson embedded in this book if you read between the lines. Putting yourself in another’s shoes, as well-intentioned as you may be, is actually arrogant. Because the truth is, you can’t. If empathy through your own eyes is a prerequisite for getting along in this world then we are doomed. You must be humble enough to appreciate that you can’t fathom how another feels. Once you choose to care about a person then you must acknowledge their terms even if you can’t understand them.
The Road
- This is a sad, depressing love story of a father to his son. It’s pure sacrifice. The narrator’s melancholy mindset and recognition of impossible odds never derails his duty to his boy. It’s the pinnacle of grace.
The Fountainhead
- Naysayers will have a lot to object about Rand. But Roark embodied integrity. Integrity is more complicated than Rand presents. I don’t think the hardest questions are in here. But Roark is a good guide for many decisions life will throw at you even if he is an incomplete (or possibly just unfinished) hero.
The Postmortal
- Imagine a pill that can give us all immortality. If you read this book that idea will fill you with dread. But you can take the lesson up a few levels of abstraction to my general conclusion: if you don’t think things through, the world will screw you by giving you what you want. Don’t make requests from a literal genie.