
I’ve explained in a past letter how the expensive put skew embedded in SPX option prices reflects 2 realities. First, the average stock in the index will see its volatility increase but more critically the cross-correlation of the basket will increase. Since index option variance is average stock variance times correlation, there is a multiplicative effect of increasing either parameter. The extra rocket fuel comes from the parameters themselves being positively correlated to each other.
In other words, correlation increasing leads to volatility increasing. Since volatility is a practical restraint on position sizing you can think of investment exposures as secretly levered to low correlations. Any battle-tested risk manager will pay close attention to not just net exposures of a hedged book but the gross exposures. The absolute size of the longs and shorts regardless of how offsetting they appear to be. Those gross exposures jump out of the closet to scare you at the worst times. When correlations rip higher.
Check out this bit from Byrne Hobart’s letter this week. First on correlation:
It’s a commonplace observation in finance that when markets go down, all correlations go to one. This makes perfect sense from a Minskian perspective: investors feel safe levering up when they expect economic fundamentals to stay healthy, but the more they lever up, the more any one fundamental change can break the entire system. But it’s also a broader truth: “Black Swans”—extreme events that blow up the assumption of a normal distribution—really only happen if a lot of seemingly-unrelated things are serially correlated. The reason models of the 2016 election underrated Trump was that they underrated the chance that the polling error could go in the same direction in every swing state. The reason credit default swaps on real estate-backed structured products were cheap in 2006 was that most investors didn’t realize that cheap credit had raised the correlation between housing markets, and that asset selection raised the correlation further within each structured product.
Correlation. A cute number between -1 and 1 upon which numbers with many more zeros rest. This can feel abstract if Excel is not your first professional language. When trying to adjust the current virus crisis to compare with historical ones, it’s useful to search for hidden forms of leverage including non-financial types.
Hobart continues:
The outcome of this is that every technology entrepreneur and investor needs to care about the global economy. The trends you’re counting on—free flow of capital, goods, information, and people—are dependent on a set of conditions that might not hold. And they’re correlated. Most useful macro discussions revolve around China, since it’s the axis around which the world economy revolves. But it’s also the lynchpin of the global electronics supply chain. Any plan that presupposes continuous improvements in smartphones and continually cheaper components assumes that China keeps on growing at the same pace, and remains tightly-coupled to the US, Europe, and emerging markets.
Manufacturers are realizing, and consumers are about to realize, that supply chains offer their own sort of leverage, with their own potential for a “Minksy Moment” in which a disruption in one place causes cascading chaos everywhere else. Coronavirus might be a minor speedbump, but it, or something like it, will eventually force a wholesale change in the pace and nature of globalization.
This week concerns of economic slowdown and supply chains as single points of failure are gripping markets. Wall Street is getting way in front of this one, calling for zero economic growth in 2020. Do we just jump to visions of empty planes and restaurants? Morgan Housel likes to remind investors of Napoleon’s definition of military genius: “The man who can do the average thing when everyone else around him is losing his mind.”
From Headlines To Numbers
Slow down to break it down. Consider what variables are being pushed around. Have a model. If your model maps variables to outputs then start turning the knobs to see how sensitive the outcomes are to different scenarios. The point here is not to do numeric Mad-Libs then believe the silly story you wrote. It’s an exercise in thinking. A model turns emotional headlines into dispassionate inputs so you can actually reason about them probabilistically.
My favorite analysis in this vein comes from the philosopher-king of valuation Professor Aswath Damodaran. He starts with his general model then shows at which nodes COVID-19 developments have an impact.
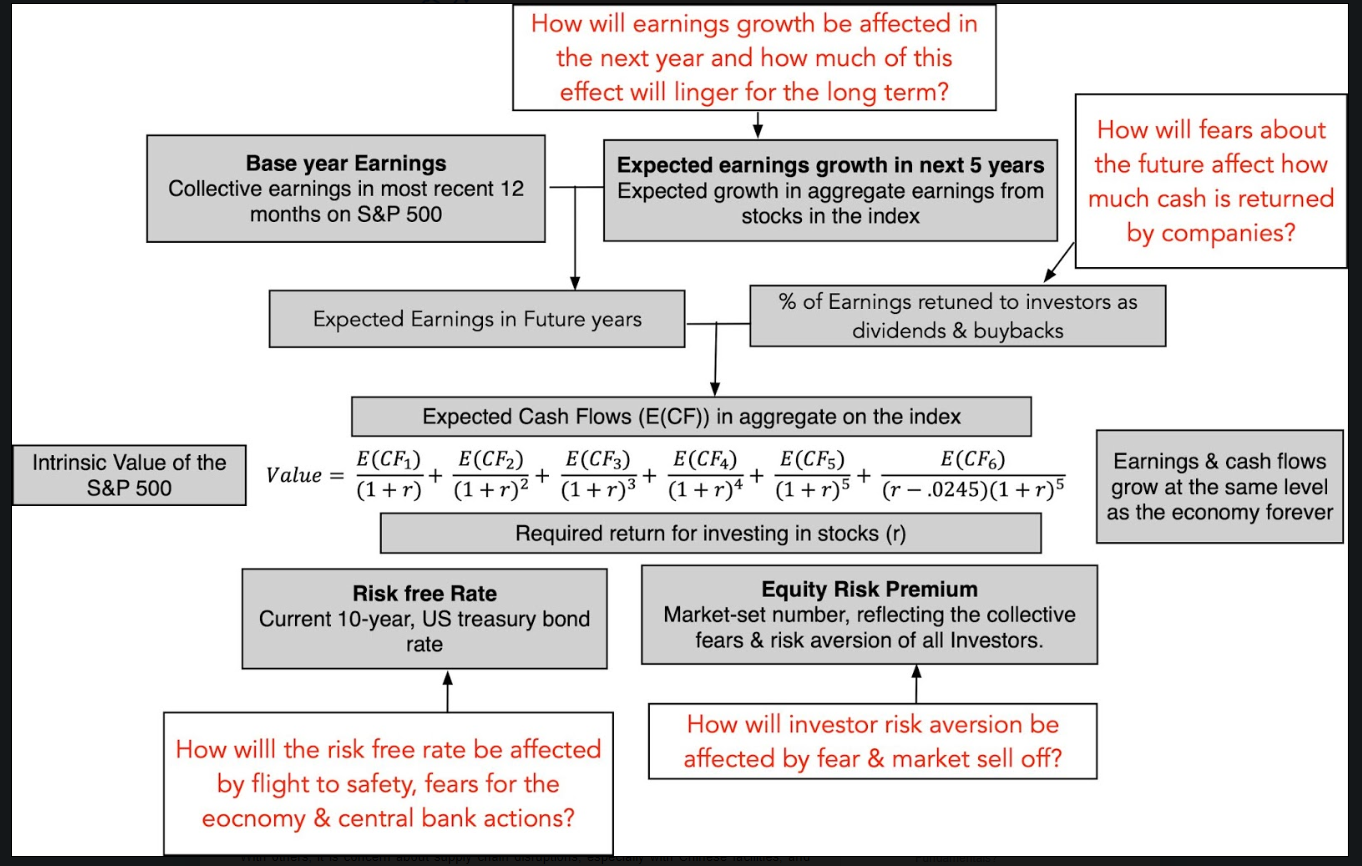
Again the actual numbers aren’t the point. It’s the calming process of seeing how abstract arguments which threaten to shut our minds down into fight-or-flight mode can be safely downshifted into cold digits. Type into cells, hit F9, generate an opinion that can just change with the facts. The full article including Damodaran’s spreadsheet. (Link)
I don’t have a strong corporate finance background. Damodaran’s website is one of the best resources on the web for learning. You can take his NYU course online or just go through his prolific writing. Tying together how growth rates, discount factors, reinvestment, and payout ratios all interconnect before arriving at valuation is actually fun to understand. I found it demystifying to work through this spreadsheet and I recommend it to anyone trying to understand the basics of how to think about share values. (Link)
If you want to see how he adjusts to new facts step through this post from Q42018 (Link)