
Friends,
This week’s Money Angle is a bit longer and options focused so I’ll give you something short here that requires no brain cells.
My niece is learning to code using pygame. Pygame is a Python based module for writing games. When she told me, I hopped on to YouTube to watch a tutorial with Zak (7) to see if we can learn together. Hmm. It was quickly clear. He was going to need some basics first.
After he went to bed, I decided to script a simple text-based game that might draw him in. It also had the oblique purpose about teaching him the basics of business math. You’ll recall I planted this seed with Zak and his podmate back in the fall. I described the process in A Socratic Money Lesson for 2nd Graders.
I’ve shared this little script game with his cousins and friends, and it gives them a quick little competition. It encourages them to read, reason, and do basic arithmetic. After they played it for awhile, I told him I wrote it. Now I can’t really code but it was just enough for the desired effect — he would think “whoa, we have the power to make a game!”. Now he is interested in at least messing with Python and trying to learn some basic syntax.
Share it with your kids and see how much money they can make at the Ice Cream Shoppe. (game)
Here’s the code. It’s not pretty but it should be easy enough to spot how to change it. (code)
The game takes less than 2 min to play. And it will introduce you to Trinket, a great site for writing and running programs in a browser.
The 4-year-old wanted to play a game too. He’s learning basic addition and loves chess so I wrote him an even simpler game. It encourages arithmetic by adding the values of chess pieces. He can’t read but his bro wrote a cheatsheet on a piece of paper so he can match the words on the screen with the words on the paper. Over time, he is figuring out that the word that starts with “p” is “pawn”.
Play it here. (chess piece game)
The Money Angle
This week, I wrote about intuition for vol dynamics as a stock moves around.
Permalink: How Options Confuse Directional Traders
Intro
2017 was a historically low-vol year, rewarding options sellers despite selling lower option premiums as the year progressed. Like they found a broken slot machine at the Cosmo. It wasn’t until the Feb 2018 “volmageddon” in exchange-traded VIX products, that retail discovered the dangers of selling options.
In the past year, retail, led by r/WSB, is back in the deep end of the options pool. This time they brought swimmies — they are only buying options. This limits their losses to the premiums.
As opposed to professional vol traders, most people use options as a way to bet on direction. You buy a put to bet on a stock going down and you buy a call to bet on a rally (or an “up” — a term coined by my doctor friend who always used to make fun of us finbros who talked about “puts and ups” all the time when we were in training). I tend to dissuade people for messing with options unless they have a very specific risk to hedge or if their speculative thesis is well-defined. Since options expire you need to be right not just on direction but timing as well. There’s a lot of ways to lose, get lured into trading more, and generally chop yourself up.
I’m going to demonstrate how you can lose money despite being very “right”. For good measure, we’ll extend the conversation to how hedging can actually increase your risk. Let’s jump in.
An Option Lesson
The recent action in GME justified the cigarette warning label I put on options. If the option user doesn’t appreciate the role implied volatility plays in an option price, then Benn’s tweet is mystifying:
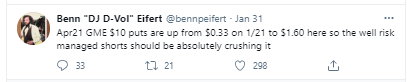
Put options increased in value as the stock went up.
Then, with the stock on the way down @mark_dow tweets:
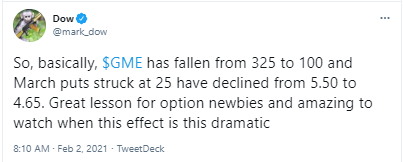
Put options lost value as the stock collapsed.
My kids would chalk this up to “opposite day” and ask to wear pajamas to school. Alas, there is a more boring explanation:
Implied volatility increased as the stock price increased and fell as the stock price fell.
Pro Version
If you are eager, we can drill down a bit.
- The option’s “vega” dominated its delta in both cases. The vega tells us how much the option’s price will change as the volatility rises or falls.
- “Vanna” represents the sensitivity of the option’s delta to volatility — a second order effect. As the vol increased, the OTM option deltas increased. This is notable because it is a positive feedback loop. As the stock and vol both increase on the way up, market makers have to buy more stock to hedge. On the way down, it is stabilizing as the vol decreasing means the option delta decreases and market makers need to be “less short” to hedge the puts…it’s stabilizing because this offsets the negative gamma effect from being short puts in the first place. This one is tricky because the vanna effect is dampening the vanilla gamma effect.
- Then there’s “volga” which is how the option’s vega changes with respect to vol. This is yet another second order effect of vol (I’ve written about that here). It feeds right back into vanna and acts as a reinforcer on the way up and a stabilizer on the way down (since spot and vol are positively correlated. We’ll get to this correlation later).
- There are higher order Greeks than “vanna” and “volga”. Ironically, they are only known by the French. Don’t ask.
Vol traders care about these cross-currents because of how they accelerate or dampen the price of options. These effects alter hedging flows which change buying and selling pressures. Outputs become inputs so each sub-cycle in the process looks like a foreshock to something bigger, or the aftershock to something dissipating.
This might sound theoretical or academic but it’s the nuts and bolts of managing volatility portfolios. An option book with many names, maturities, and strikes looks like an amorphous blob until you use these concepts to give it shape. Once it has shape you can recognize what kind of animal it is. You can predict how it might respond to different scenarios. The measurable risk is how it will react to the market’s movements. The stock is going to do stuff. That’s a given. You are not allowed to be surprised by that fact.
The real concern is if the portfolio, this animal under your care, acts outside your range of expected behavior.
Normie Version
Rest easy. That was utter overkill for investors or even casual option punters. To understand why puts got cheaper on a selloff, you just need this picture:

It is a beautiful and simple visual intuition constructed by @therobotjames.
- The purple bell curve is the distribution of GME stock when it’s trading for 600% vol and $200.
- The green bell curve is the distribution of GME stock when it’s trading for 400% vol and $90.
Explanation
Despite the higher stock price, the purple curve imputes a higher probability of the stock going below $20 because the distribution is much wider at 600% vol than at 200% vol. The impact of the vol totally dominates the moneyness, or distance, the stock is away from the strike. Another way to say this is “the $20 strike is closer to $200 than it is to $90” if the volatility is that much higher when the stock is $200. This is easier to understand if we simply make the volatility disparity wider. Imagine a govt bond that trades for $100 par and a stock that trades for $200. Nobody would be shocked if the 50 strike put for the stock was worth more than the 50 strike put for the bond.
Self-contradiction?
I can you scratching your head. In GME, we are talking about the same exact asset at 2 points in time with a contradicting proposition: namely that the probability of the stock dropping below $20 when the stock is $200 is higher than when the stock is $90!
This paradox is an illusion that happens whenever you have the benefit of hindsight. You don’t know which of these prices is the true odds. You can only trade with the information you had at the time. You cannot arbitrage the relative pricing between the 2 states of the world that we have the luxury of seeing in the rearview. Looking back you can say that the stock’s chance of going below $20 was underpriced when it was trading $90 or that it was overpriced when it was trading $400 but you couldn’t make those claims at the time. They only seem paradoxical when compared to each other.
At this point, I suspect retail traders, curious as to why they won to buying puts on the rally and lost to buying puts on the selloff, developed some understanding of vol dynamics.
Hopefully the tuition wasn’t too steep. Not all lessons are as cheap as a defined option premium.
The Expensive Option Lesson Pros Learn
Professional option traders adjust option greeks for spot-vol correlation. In the GME-case the correlation is positive just as it is in agricultural commodities. As the price increases, the vol increases. Most markets have a negative spot-vol correlation. The VIX falls when the SPX rallies. This is also true in the oil market. A supply of options hits the market during rallies as large hedgers overwrite calls.
To adjust for this, option traders will model a negative spot-vol correlation or “vol beta”. For example, suppose your ATM call option typically has a 55% Black-Scholes delta. you might model a 50% delta only, knowing that if the future goes up $1, your call option probably won’t increase by $.55 since implied vol will fall. (In fact, one of the ways to know if the counterparty you are quoting was a bank or not was by the delta the broker wanted to use to use on delta-neutral structures. Banks often quoted with Black-Scholes deltas while prop shops used deltas which incorporated vol betas, effectively lowering all call deltas).
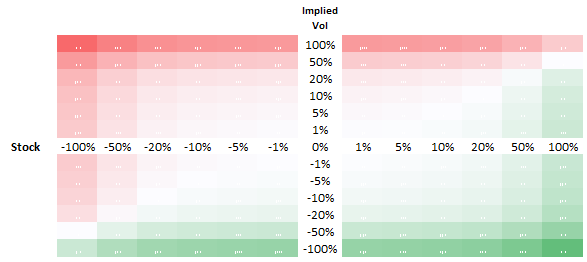
When you model vol beta you are usually making a trade-off between hedging local behavior of common moves versus more unusual sized moves which will break the spot-vol correlation, in turn upending calibrated deltas. If a skirmish broke out in the Strait of Hormuz and oil ripped 10% higher I would not expect volatility to fall. Therefore, you also need to consider a matrix of outcomes.
(This is a hypothetical picture which tells us if oil rallied 10% and vol increased 50% we would lose money. Note that if vol fell in accordance with a vol beta we would have made money).
Even with respect for local and jump spot-vol correlations, you can still be caught off-guard. In nat gas, I’ve underestimated just how GME-like its vol surface can change. I’ve seen put prices not budge despite a 20% selloff in an underlying. If you are running a hedged book and have any long futures against the puts you enjoyed the full drawdown in futures without any offset from the puts. Enough to make a burly man cry.
The idea that “you only risk your premium” when you buy options is only true if you do not hedge. It’s diabolical to get crushed on a supposedly neutral position. Why? Because, you thought you were hedged. This tricked you into buying more puts than you would have if you didn’t hedge.
(All basis trades have this dangerous property. The illusion of being hedged induces you trade bigger or use leverage to push a small edge.)
Qualitative Appreciation For Spot-Vol Correlation
The GME put holder who lost money on a sell-off now understands how the change in implied volatility explains the loss. Regrettably, this is like being told you missed a flight because you were late. It’s just a mechanical explanation. What you really want to know is why did volatility come in as much as it did? In option trader terms, “why did the vol beta outperform or underperform in the first place?”
The beta itself will have quite a bit of variance since a price can follow many paths to a destination. Those paths will each be a sample of unique realized volatility. Did the price grind to X or did it gap to X? The realized beta will vary from your projected one depending on the path and the market’s interpretation of that path. If the stock gaps down due to a specific bit of news (for example news that a big short is done covering or the company issuing more shares) the gap can actually be vol-reducing as the market interprets the news as “stabilizing”. If the gap comes with no explanation, then the market might interpret this data point as another mystery piled on an already burning heap of confusion. The market will presume that the crazy stock might just rip back up again. In this case, the vol might hold up better on a sell-off that occurs without a reason in contrast to the the prior case where the reason had the narrative effect of curtailing the upside.
So in the GME case, most of the reasons the price can go down are stabilizing. We expect options to be sold in response to a sell-off, and for the vol to decline. But “most of the reasons” does not mean 100% of the reasons so there is a probabilistic distribution to what the realized spot-vol correlation could be. And that’s why we still have surprises.
The Beauty Of Options
Ultimately, options help to “complete” a market. A simple stock price is just the expected value of a stock (equity risk premia and arbitrage pricing theorists are welcome to have a cage match over that statement. I’ll be out back selling beer). By imputing more information than a one-dimensional expected value, option surfaces give us a richer picture of expectations. What’s considered stabilizing, and what’s considered unthinkable are encoded in options markets.
There’s a silver lining to the WSB obsession with options. Some of these people who showed up for a thrill will stick around to learn how to listen to how a vol surface whispers.
Last Call
- How Did The World Get So Weird? (link)
Matthew CliffordExcerpts:
GameStop is the latest example of variance-amplifying institutions (VAIs) triumphing over variance-dampening institutions (VDIs). These institutions differ in what behaviours they promote and what characteristics they select for. VDIs select for norm adherence, predictability and consistency. They create negative feedback loops; bureaucracy is the canonical example. VAIs select for extremeness, surprise and virality. They create positive feedback loops; the internet is the canonical example…
For many decades, most ambitious people have not been doing catastrophically destabilising things. You might not like McKinsey, Goldman Sachs, Google, et al, but hierarchical institutions are an ambition shock absorber. The people competing to get to the top of each are (generally) following rules and channeling their ambition into non-violent, non-destructive activity – a happy anomaly in historical terms. This makes for fairly coherent, homogeneous elites (which again you might dislike) who are committed to societal stability…
VAIs are an increasingly attractive path for the most ambitious, precisely because they allow for extreme outcomes on impatient timelines. This creates a subset of elites who owe little to conformity and norm adherence. In general, the winners of internet-scale contests look and behave nothing like the winners of hierarchical contests.
The variance genie can’t easily be put back in the bottle, at least not without severe repression. There is no “pre-2016” world to return to. A free internet entails a world more variance and more tail risk. We must learn to live with it.
- Interview with Theresa Vu (“TVu”) (podcast)
Growth from FailureTheresa is a rapper slash engineer. From her music origins at Cal to being an early an employee at App-Nexus (think digital ad high-frequency trading), TVU weaves a deeply reflective and fun story. Her thinking is exceptionally lucid. She exhibits a remarkable degree of not only self-awareness but consideration of others emotions. Hear how the engineering concept of “graceful degradation” relates to your own life. If you have immigrant parents, this episode is going to have you nodding right along.
From my actual life
Sooooo, we’ll be doing less of that.
Today, we fired this thing up which came with our rental.


4 racks of ribs and a chicken We used oak to smoke the ribs for 2 hours at 250 degrees before finishing them in the oven wrapped in foil and apple juice for another 2 hours.
Meat sweat time.